Where Is The Top?
|With the Sensex breaking 20000 and the Nifty making significant highs, many investors are wondering if the markets will be able to take out the previous highs. Investors are eagerly awaiting the budget to see if the markets will indeed continue their bullish run after the recent basing.
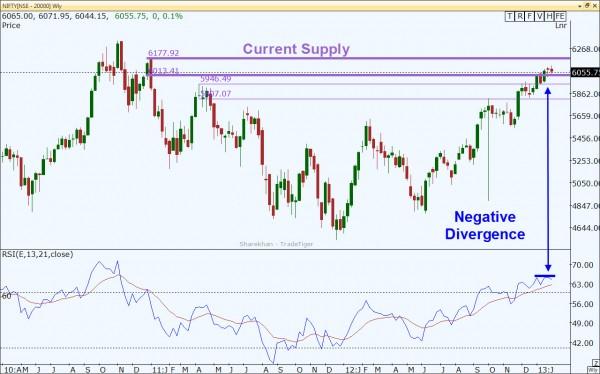
The best thing we can do as traders is to look to the charts for the actual clues to the market direction. Looking first to the Nifty, we can see that price has been trading right into a supply zone. With the slow entry into that zone, you would expect that if we do drop from the zone, it would only be a correction and not a trend reversal. A healthy correction to the 5650 demand is likely and also confirmed by negative divergence on the RSI. As long as we do not have the RSI drop below 40 when we correct, we should see new highs afterward. This was confirmation of bullish trend continuing as the corrections indicated in June, July, Sept, and Nov. 2012.
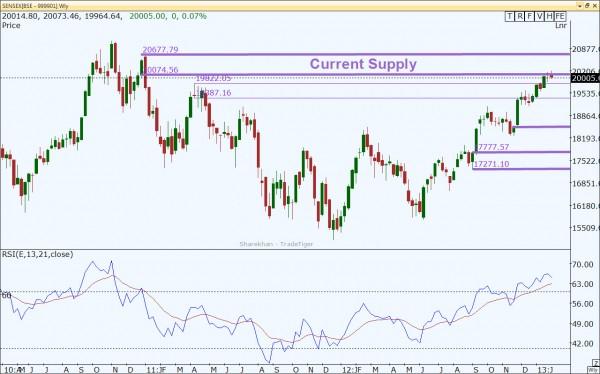
The Sensex is also into supply with a slow approach. I would have expected a sharp declining only if we approached the supply quickly. As of now, I am only seeing a pullback likely to the 18500 levels.
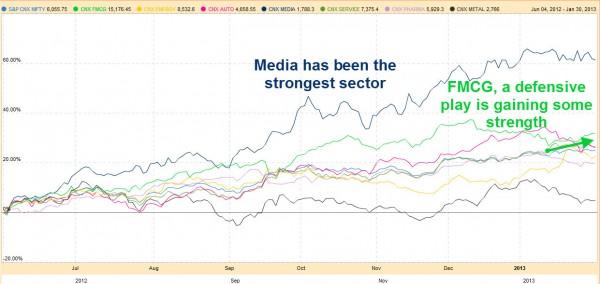
Those of you who have been in my Professional Trader class or in the Extended Learning Track course know that I like to look at the sectors that are fueling the markets in order to determine whether the markets are likely to continue their trends. I looked back on the equity index charts to see where the current bullish move began. I started my study from the June 4th 2012 lows. When I compare the sectors from the start of the bullish run, I see that the move was one that was participated in by all of the sectors and was healthy. The strongest sector was the media.
As the equity markets were nearing the recent supply levels, all of the sectors were moving lower except for FMCG. This shows nervousness in investor sentiment as they shift funds into safer sectors. If we do not see a large drop in cyclical stock investments (autos, IT, durables etc) then we should only see a pullback in the indexes.
Intraday traders should look at profiting from the short side of the market as the daily charts will be leaning toward short-term downtrends. But once those demand zones are reached, look for the long opportunities to test the prior highs.
Information on these pages contains forward-looking statements that involve risks and uncertainties. Markets and instruments profiled on this page are for informational purposes only and should not in any way come across as a recommendation to buy or sell in these assets. You should do your own thorough research before making any investment decisions. FXStreet does not in any way guarantee that this information is free from mistakes, errors, or material misstatements. It also does not guarantee that this information is of a timely nature. Investing in Open Markets involves a great deal of risk, including the loss of all or a portion of your investment, as well as emotional distress. All risks, losses and costs associated with investing, including total loss of principal, are your responsibility. The views and opinions expressed in this article are those of the authors and do not necessarily reflect the official policy or position of FXStreet nor its advertisers.