Trading Using Fear and Greed
|The emotions of fear and greed are clearly identifiable on a price chart if you know what to look for. This is important if we want to spot the traders that are usually selling at the lows of a move, or the ones chasing the market by buying just as the market turns down. In order to do this, we must learn what configuration, or pattern best represents these two emotions.
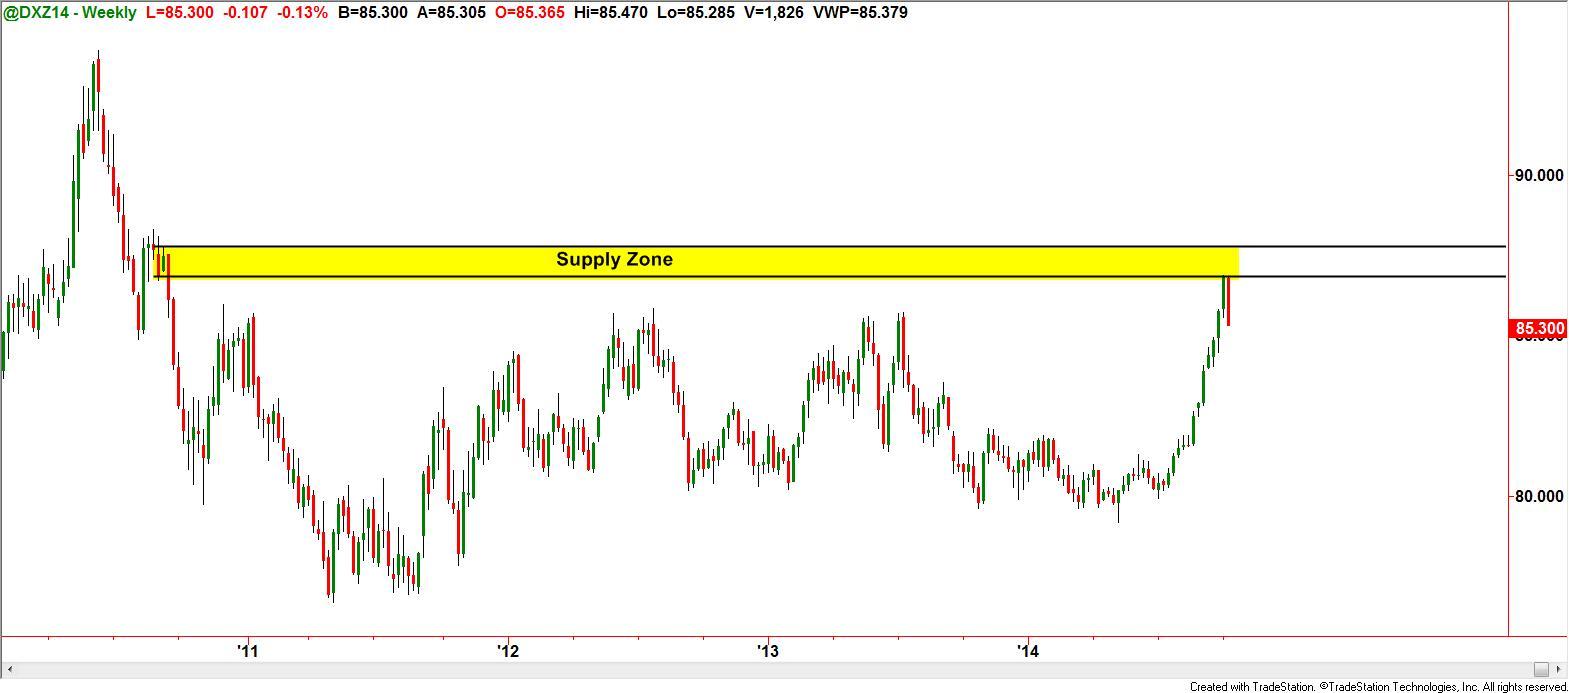
When looking at a price chart, most traders look at the overall direction of the market, and are conditioned to trade in that same direction. In certain market cycles, these tactics would be fine, however there is a time when a trend reaches a fever pitch and that’s when greed shows up on a price chart. The weekly chart of the US Dollar Index below illustrates that when a strong move (the picture of greed) comes into a large institutional sell order, the most probable result is that all the late buyers will simply have to suffer as the market retreats.
Over the last three months the US Dollar Index has been in an extremely strong uptrend and buying in this uptrend (early on) was very profitable, but as I stated earlier, knowing when the trend was likely to change is a function of market psychology. This entails looking for the last greedy buyer to enter the market. In this example this meant that supply was nearby.
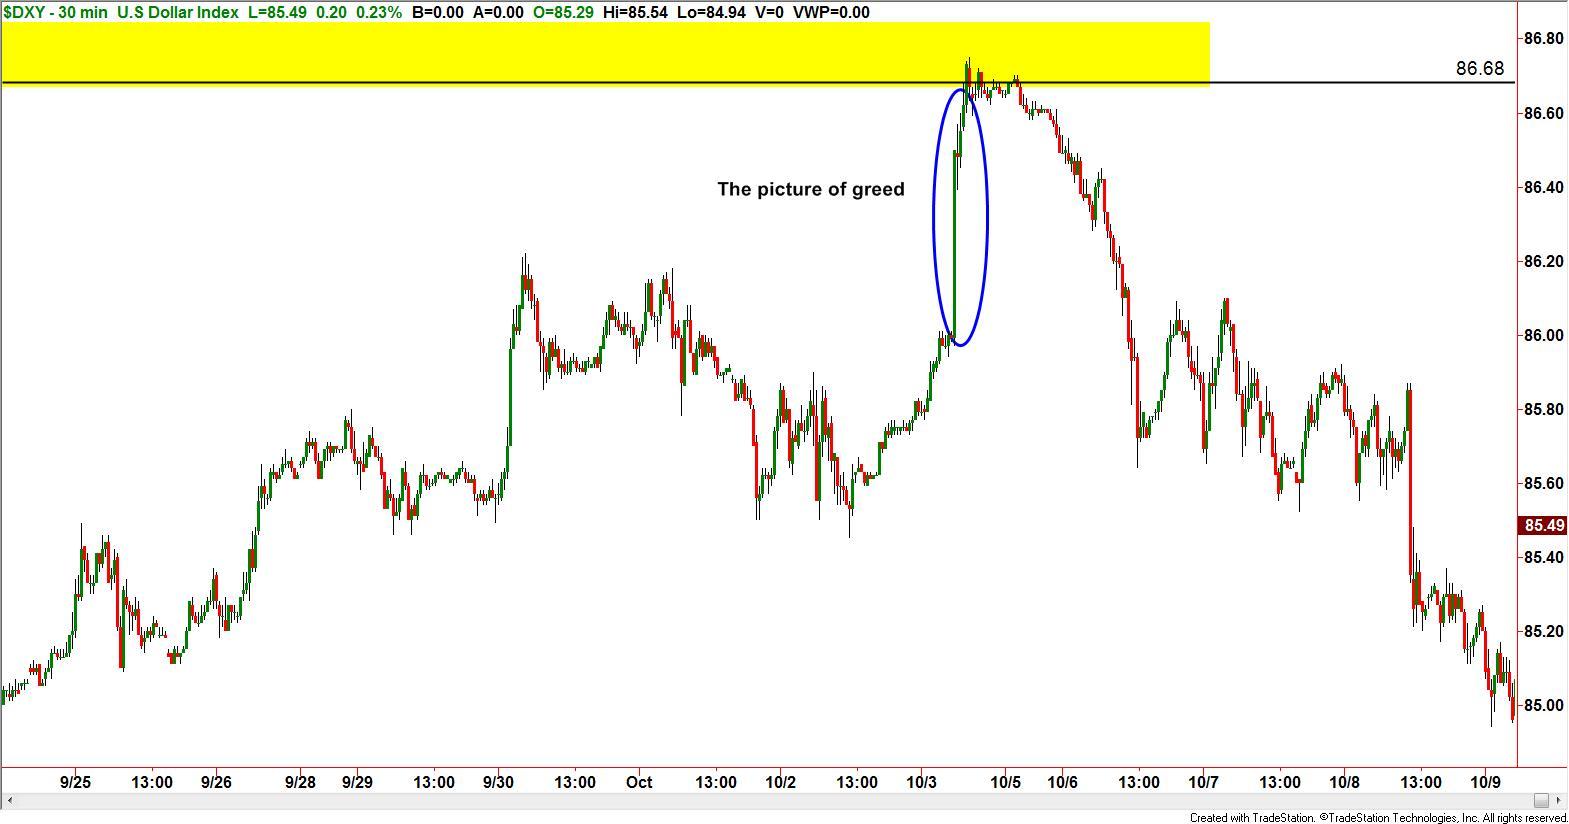
As we can see on a lower time frame chart of the DXY, the picture of greed is seen a little clearer.
When looking for the fearful seller to buy from (especially when the market has been dropping for some time), the picture looks like the mirror image of greed,with one exception, the emotion of fear is much stronger. For a trader that understands this, it means opportunity.
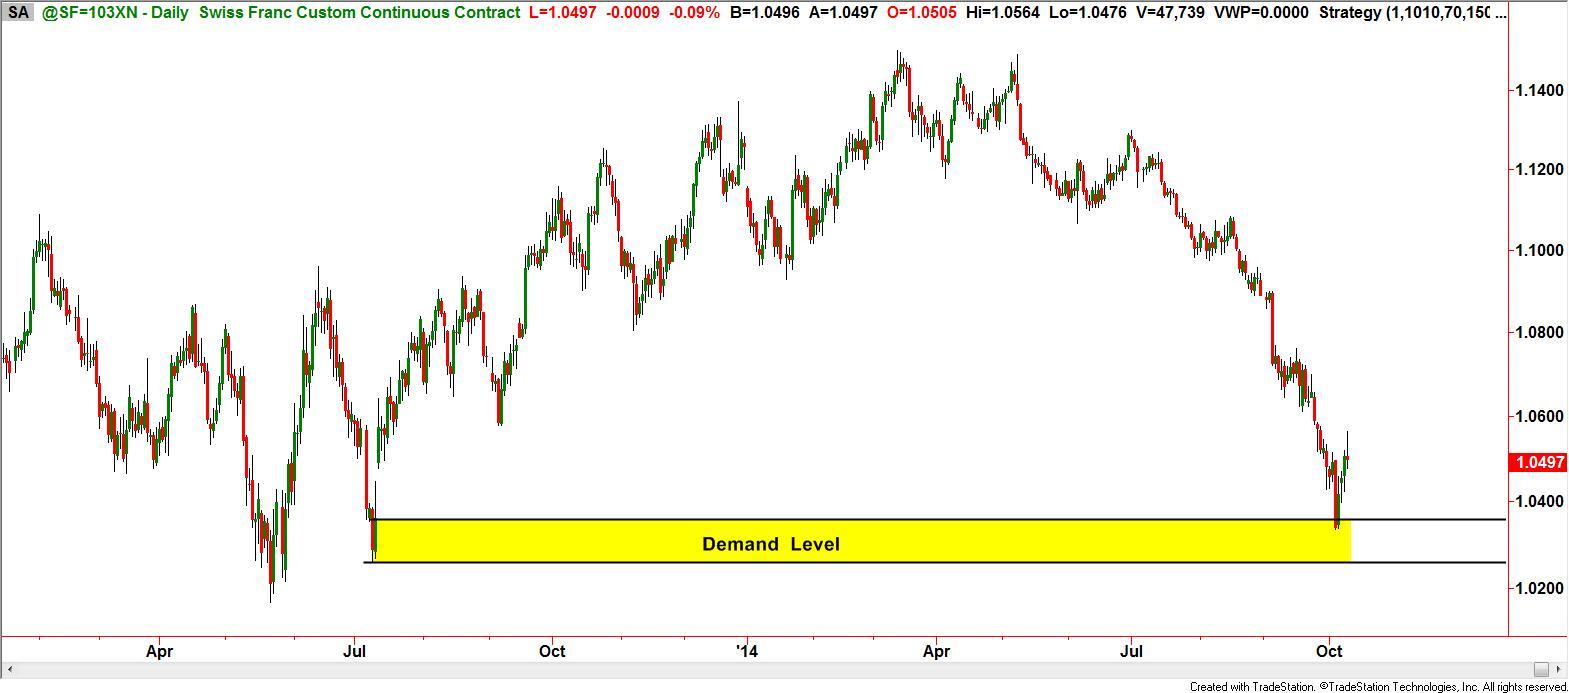
On the chart below we can see that the Swiss Franc Futures contract has been a steady spiral downward. In addition, the majority of traders in this currency were probably short and very negative on the prospects for this nation’s currency to turn around.
Similar to the Dollar moving higher, moving to the short side of this currency early in the trend paid handsomely, but there’s a time when the pessimism is too much. This is when all the longs have given up and everyone is short, convinced that the currency is going to be worth very little. This tends to happen just as we approach a strong demand zone.
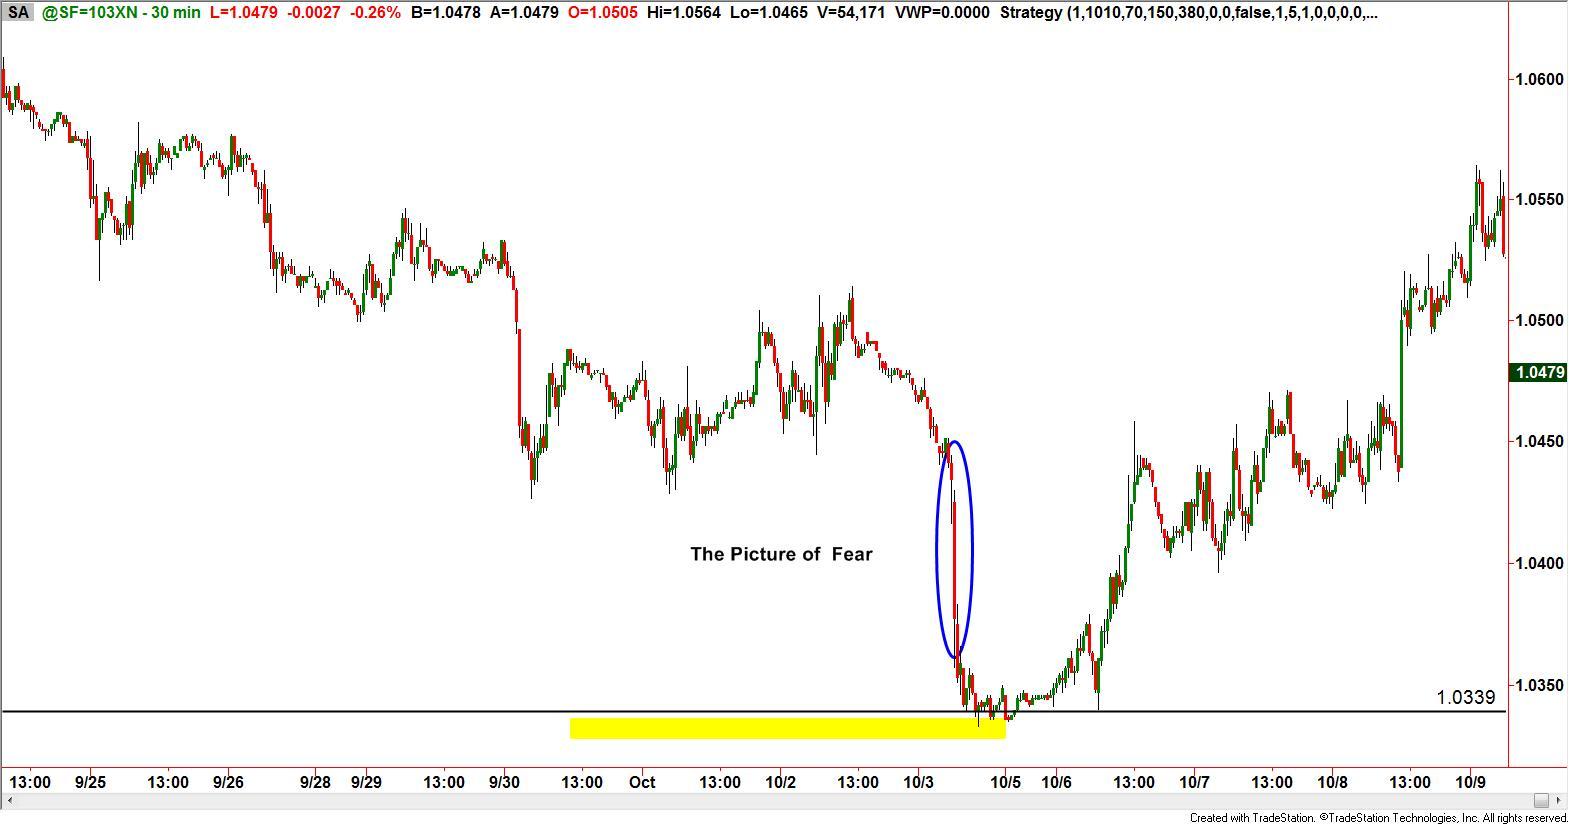
And just as before, in the smaller time frame we can see the picture that represents the fearful seller, or in this case then it may also be the last short seller that’s convinced the Swiss franc is going a lot lower
In the final analysis, trading profitably is a function of buying low and selling high, anticipating when the market will turn, and doing this with high probability. Knowing who’s on the other of side the trade, and what that picture looks like is part of this process. I hope this helps to better recognize this so that you can be on the right side when the market turns.
Information on these pages contains forward-looking statements that involve risks and uncertainties. Markets and instruments profiled on this page are for informational purposes only and should not in any way come across as a recommendation to buy or sell in these assets. You should do your own thorough research before making any investment decisions. FXStreet does not in any way guarantee that this information is free from mistakes, errors, or material misstatements. It also does not guarantee that this information is of a timely nature. Investing in Open Markets involves a great deal of risk, including the loss of all or a portion of your investment, as well as emotional distress. All risks, losses and costs associated with investing, including total loss of principal, are your responsibility. The views and opinions expressed in this article are those of the authors and do not necessarily reflect the official policy or position of FXStreet nor its advertisers.