Helping Your Odds in Forex Trading
|Hello traders! Sooo…neither of us won the Powerball Jackpot of $1.5 billion dollars. Not that much of a surprise, is it? Knowing that the odds of winning were something like 1 in 292,000,000, we shouldn’t be shocked that we didn’t get the easy money. Now that the hype of the Powerball super- size jackpot has died down a bit, let’s discuss how we can increase the odds of success in trading, shall we?
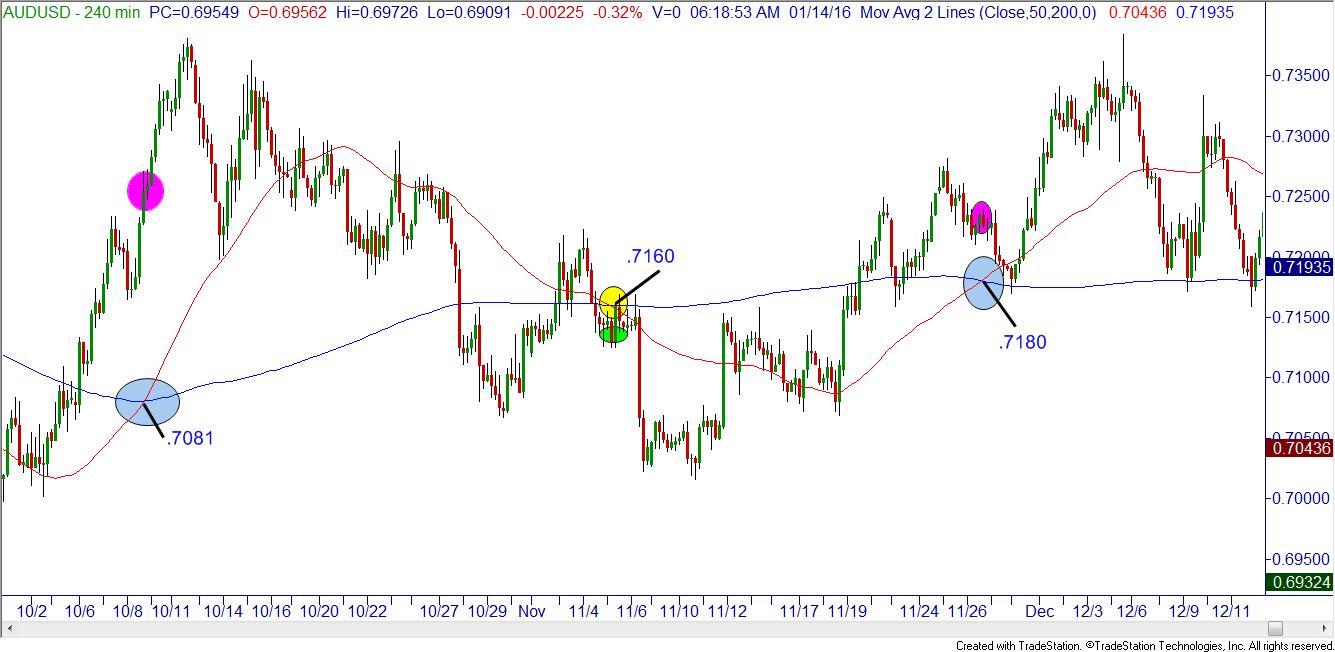
Most people, when they first get into trading anything, end up reading a book about technical analysis or even perusing a few free websites trying to figure out how/when to enter and exit their trades. Very often they will use a set of “classic” technical indicators to make their decisions, such as a moving average crossover. In the following 240 minute AUDUSD chart, I’ve marked three moving averages crosses. Generally speaking, a new trader will buy when the faster moving average (in this case the 50 period) crosses upward through the slower moving average (the 200 in this example). This same trader will sell when the faster moving average crosses down through the slower. The “buy signals” are marked in blue, while the “sell signal” is marked in yellow.
Here is the huge problem. When looking at the chart, many new traders are looking at the price point where the moving averages CROSS, not where the price is when the moving averages cross. No, I’m not making this up. Having taught thousands of traders in my ten year tenure with Online Trading Academy, I’ve seen pretty much every mistake that exists in trading. (If you have a “new” mistake, one that hasn’t ever been done before, let me know!)
I’ve written on the chart what the prices of the crossovers were; the first buy in blue was .7081, the yellow sell was .7160, and the second blue buy was .7180. If you took these numbers as what you thought your entries were, you might have thought that you made about 80 pips on your first long trade (bought at .7081 and sold at .160). If you went short when you exited your long trade you would have lost only 20 pips (sold at .7160 and bought to cover at .7180) for a net gain of 60 pips. Not too bad, right? However, what were the prices of the actual CANDLES when the moving averages actually crossed? Uh oh, now we have a problem!
I’ve marked the actual prices on the chart as well. The first buy in the pink circle would have been at about .7250, the sell at .7135 (in the green circle), and the second buy at about .7230. Suddenly this technique looks terrible! So, the actual performance would have been a loss of about 115 pips on the first long trade; again, if you reversed your position when the moving averages crossed the short would have made a loss of about 95 pips! You can probably surmise what I think about moving average crossovers…
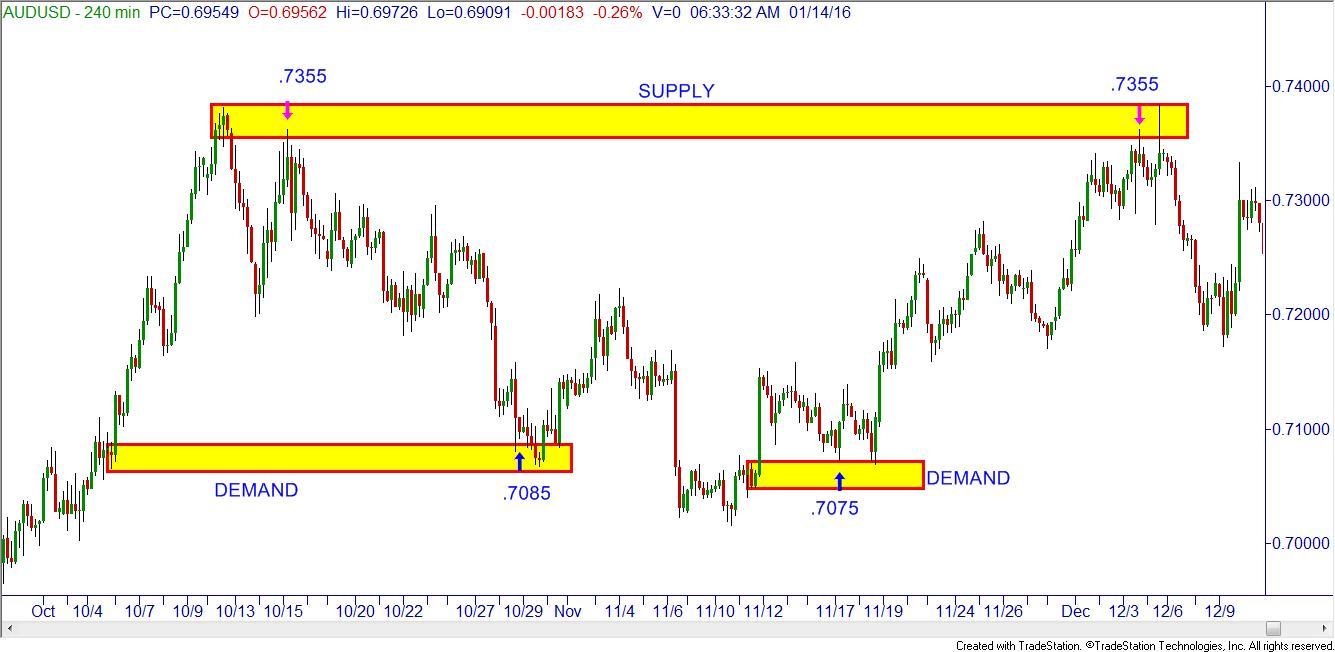
Here is another picture of the same pair and time frame, but instead I marked in a couple of demand zones and a supply zone. If you are new to Online Trading Academy, our core strategy tells us to buy in (what we believe is institutional) demand and to sell in (institutional) supply. Using our strategy, a short trade could have been taken at .7355 and covered at .7085-a gain of 270 pips. A long trade could have been taken at .7075, and exited at .7355, for a gain of 280 pips! A bit better performance, wouldn’t you say?
I want to mention one last tidbit to increase your odds in trading. Push back a bit from the screen you are reading this on. Now, notice how we have a relatively clear sideways channel over these couple of months of trading. Ever play the high-low game with a deck of cards, where you pull out a card and make a bet on if the next card will be higher or lower than the first? If you pull a 3, what are the odds that the next card will be higher than a 3? Pretty good, I would guess! If you pull a King, what are the odds that the next card will be lower than the King? Pretty good again! Now, if you pull a 9…now what? That’s pretty close to 50-50 odds that the next card could go either way. Using Online Trading Academy’s proprietary Odds Enhancers helps us to determine (figuratively speaking) what card we have pulled. Selling at the .7355 is like pulling a King…buying at the .7075 is like pulling a 3. Pretty high odds that the next card (trade!) will work out. To more fully understand how these Odds Enhancers can help you in your trading, see you in class!
Information on these pages contains forward-looking statements that involve risks and uncertainties. Markets and instruments profiled on this page are for informational purposes only and should not in any way come across as a recommendation to buy or sell in these assets. You should do your own thorough research before making any investment decisions. FXStreet does not in any way guarantee that this information is free from mistakes, errors, or material misstatements. It also does not guarantee that this information is of a timely nature. Investing in Open Markets involves a great deal of risk, including the loss of all or a portion of your investment, as well as emotional distress. All risks, losses and costs associated with investing, including total loss of principal, are your responsibility. The views and opinions expressed in this article are those of the authors and do not necessarily reflect the official policy or position of FXStreet nor its advertisers.