Currency Pairs and Correlations – Part 1
|Hello traders! In this week’s newsletter-the first of a two-part series-I’d like to show a little bit about how some currency pairs in the spot forex market seem to move together, and how we can use this to help make a few extra pips in the market.
First of all, I’d like to define what correlations are in trading. As usual, I’ll rely on Investopedia for help in this department:
DEFINITION of ‘Correlation’
In the world of finance, a statistical measure of how two securities move in relation to each other. Correlations are used in advanced portfolio management.
INVESTOPEDIA EXPLAINS ‘Correlation’
Correlation is computed into what is known as the correlation coefficient, which ranges between -1 and +1. Perfect positive correlation (a correlation co-efficient of +1) implies that as one security moves, either up or down, the other security will move in lockstep, in the same direction. Alternatively, perfect negative correlation means that if one security moves in either direction the security that is perfectly negatively correlated will move in the opposite direction. If the correlation is 0, the movements of the securities are said to have no correlation; they are completely random.
In real life, perfectly correlated securities are rare, rather you will find securities with some degree of correlation.
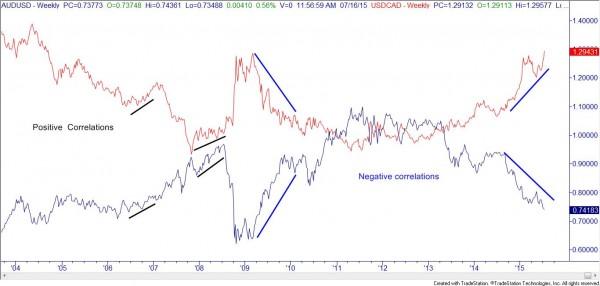
Additionally, you may have heard positive correlation referred to as “direct” correlation and negative correlation referred to as “inverse” correlation. In the following chart, you can see that the AUDUSD (represented by the blue line) and the USDCAD (represented by the red line) overall tend to move in the opposite direction-which would mean a negative correlation. A couple of positively correlated areas are marked with black lines, and negatively correlated areas are marked with blue. Obviously, the overall negative correlation is more frequent than the positive correlation periods. Can you spot a few more periods where the correlation is very strong?
Anyone want to take a guess as to WHY these two currency pairs offer such obvious negative correlations? There are two main reasons, actually. The first is that both the AUD and the CAD are what we call “commodity currencies.” Because both Australia and Canada are producers of raw materials, commodities, if those prices go up it is normally good for these two economies. If the prices go down, normally that would be bad for the raw material producers. The second reason is because of the SIDE of the currency pair they are on. In the AUDUSD, the AUD is the base currency; in the USDCAD, the CAD is the quote currency. Because they are on opposite sides of the teeter totter of the symbol, it would cause the charts to move how they do.
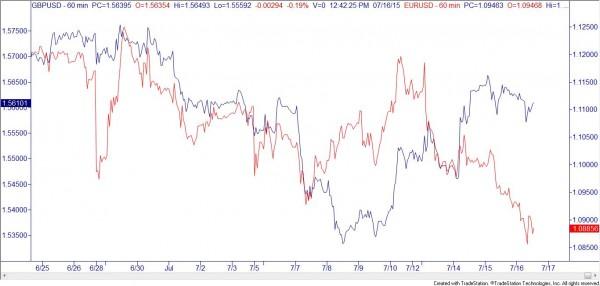
In this chart, we see the GBPUSD in blue and the EURUSD in red on a 60 minute time frame. Notice the very obvious positive/direct correlation! It’s so obvious I’m not even going to mark them on the chart.
Now that you’ve seen examples of both positive and negative correlation you must be fascinated with the wiggly lines and are dying to put them on your computer. However, what will you do with this information? I’m glad you asked. There are actually several potential ways that you could use strong correlations in your trading. The first way to use these correlations is to remind you to not “double up” on a position. For example, if you went long the AUDUSD, what did you really do? You purchased the AUD and simultaneously sold the USD. If you were to go short the USDCAD, you sold the USD and went long the CAD-essentially doubling up on a short USD trade. Now, that isn’t in and of itself unheard of, but it is something professionals are at least aware of. What about if you were long the AUDUSD and were considering going long the USDCAD? That would mean that you bought the AUD, sold the USD, then turned around and BOUGHT the USD and sold the CAD. So, you actually went long the AUDCAD currency pair, as the USD parts of the two trades cancelled each other out! This is commonly called a “synthetic” currency pair. There are some valid reasons for doing this on purpose, for example the “synthetic pair” might have low liquidity while the two legs that created the synthetic have good liquidity; if you didn’t plan on doing the synthetic trade you might not get the outcome you expected.
In my next article, I’ll show another couple of ways to use correlations to help squeeze out a few extra pips!
Information on these pages contains forward-looking statements that involve risks and uncertainties. Markets and instruments profiled on this page are for informational purposes only and should not in any way come across as a recommendation to buy or sell in these assets. You should do your own thorough research before making any investment decisions. FXStreet does not in any way guarantee that this information is free from mistakes, errors, or material misstatements. It also does not guarantee that this information is of a timely nature. Investing in Open Markets involves a great deal of risk, including the loss of all or a portion of your investment, as well as emotional distress. All risks, losses and costs associated with investing, including total loss of principal, are your responsibility. The views and opinions expressed in this article are those of the authors and do not necessarily reflect the official policy or position of FXStreet nor its advertisers.