Some Moving Average Help for Spot Forex
|Hello traders! This week’s newsletter finds me taking a couple more weeks off; so home in Dallas, Texas until the second week in July. So far, no 100 degree days for us! I’ll take it. But the real purpose of this newsletter is to not talk about our (so far!) mild summer, but to explore one of the most popular technical analysis techniques, the moving average. We’ll first explore what they are, then how some traders use them and, finally, how I personally use them. On with the show!
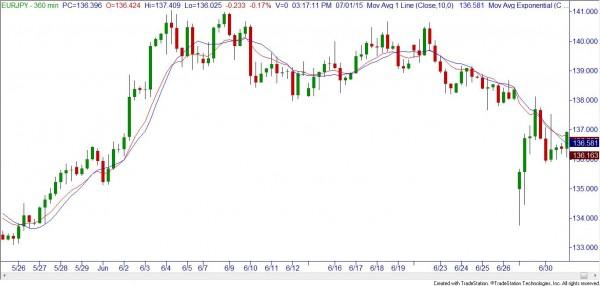
First of all, what is a moving average? On this chart, I have attached two moving averages, one blue and one red. The blue line is what we call the 10 period, simple moving average. To perform the calculations to get the moving average (MA for short), usually you would take the last 10 (in a 10 period, no kidding) closing prices of the candles, add the numbers up and divide by ten. When the next latest candle closes, you would get rid of the oldest candle’s closing data point and use the newest candle, so you still have 10; add them up, divide by ten and get the latest average data point. So on and so on. Using this formula is commonly called a “simple moving average.” Now, the computer is kind enough to not only plot the data points for us, but to “connect the dots” of all those data points-which gives us the “moving” part of the average.
Now, what about the other line, the red one? That is what we call an “exponential” moving average, where more emphasis is put on the more recent data than the old data. There are a couple of ways to do the math but for brevity’s sake I’ll let you go on the internet to find the math. Bottom line, the exponential MA follows the current price more closely than the simple MA. When price turns lower, you can see the red line turns before the blue does; when prices go higher, the red line turns higher before the blue.
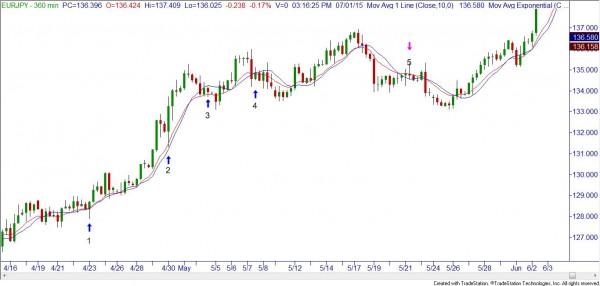
So far we’ve just defined the extreme basics of what MA’s are. Now, how do many traders use them? I believe that MA’s are one of the more misused analysis techniques that exist – I’ll show a couple examples of those common mistakes. The first mistake is buying the currency pair every time it moves down to an upward trending moving average, or selling the pair every time price moves up to a downward sloping moving average.
As you can see, the idea of buying at the pullbacks to the blue arrows makes sense-but where would your stops go? On most of the trades marked, if your stop was just on the other side of the moving average you would have been stopped out on nearly every trade-except trade #2! There are two problems with the entry at blue arrow number 2; the first is that you had to be very quick to get into the trade as there was nothing else indicating a good place to buy. The other problem is you are buying after the price has already been moving up for days!
So, the commonly used techniques are to use the MA’s for direction (long when trending up, short when trending down), and to enter at or on the MA. On a cynical note, if this technique is so awesome, why aren’t there many more traders making tons and tons of pips? Well, because they aren’t using supply and demand to enter their trades. Let’s break down how I prefer to use MA’s.
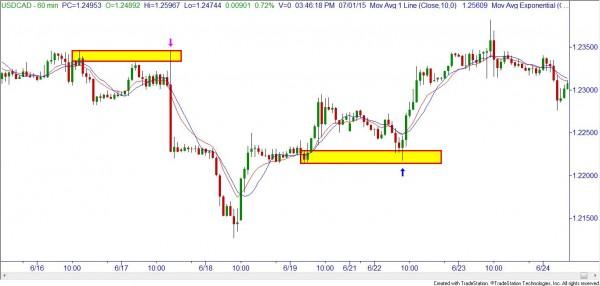
While the techniques mentioned above can certainly help when used properly with supply and demand zones, one idea that I’ll throw at you this week is to trade in the opposite direction to the MA’s. I say this because the “A” stands for average and very often a fast move away from the average is followed by a fast move back to the average-a reversion to the mean type of trade (yes, Bollinger Bands can be used in a similar way). At the pink arrow we have a supply zone that was quickly tested and as price moved up, high and far away from the MA, a potential sell order could be placed.
At the blue arrow a nice demand zone was retested, with price under the moving average-indicating prices were CHEAPER than average. Kind of like being on sale! Not a bad place to take a long trade.
Another way that I recommend using the MAs is to let your winners run when taking trades in the direction of longer term MAs (which ones? See you in class!) When going against a longer term trend I am quicker to take profits. When trading with the longer term trend I prefer to set my reward to risk ratios to more like 5:1 or higher.
So there you have it. A brief definition of what moving averages are, a common way to trade them that doesn’t work and a couple more that hopefully will help you pull in more pips.
Information on these pages contains forward-looking statements that involve risks and uncertainties. Markets and instruments profiled on this page are for informational purposes only and should not in any way come across as a recommendation to buy or sell in these assets. You should do your own thorough research before making any investment decisions. FXStreet does not in any way guarantee that this information is free from mistakes, errors, or material misstatements. It also does not guarantee that this information is of a timely nature. Investing in Open Markets involves a great deal of risk, including the loss of all or a portion of your investment, as well as emotional distress. All risks, losses and costs associated with investing, including total loss of principal, are your responsibility. The views and opinions expressed in this article are those of the authors and do not necessarily reflect the official policy or position of FXStreet nor its advertisers.