Is The Trend Always Our Friend?
|Earlier this week I was teaching a lesson in the ongoing Extended Learning Track program for Online Trading Academy, which is a session that revises content learned in the classroom-based environment and then applies it to live markets. As it stands, the session I taught was one of my favorite topics to talk about, namely, multiple time frame analysis. As we all know, consistent trading in the worldwide currency markets has its challenges and we can choose to keep our analysis as simple or complex as we choose. However, my colleagues and I would always say that a trading strategy needs to be simple and rules based to make it truly worthwhile and obviously easy to execute in a regular fashion. With this in mind though, it is vital to remember that avoiding or ignoring the power of multiple timeframe analysis in trading can be a costly endeavor.
So, if we understand that using a number of different charts to get a clearer picture of a market is a necessary practice, then why don’t people do it more often? It is amazing how many people I meet that day-trade on a regular basis, yet only look at small timeframes and wonder why their results are inconsistent. They haven’t been taught to follow the trend and use small charts for precise entries so they often complain about direction and are left scratching their heads wondering why they have been following the trend, and then as soon as they enter a trade they find the trend reverses on them. If you have ever heard of the common trading phrase, “the trend is your friend,” you too may have suffered from the same frustration from time to time. I know I did! One way to avoid this pitfall is to simply avoid using small timeframe charts alone, just because you are an intraday trader. Following the trend is a key lesson in any new trader’s educational journey and a lesson which I do agree with to a certain extent. However, we must remember that any trend is something that has already happened and when we trade we are trying to determine what is actually going to happen next. Obviously, trends do have the tendency to continue to a degree but, as we know, changing trends also occur and being aware of this and learning how to interpret it becomes a powerful skill in any trader’s arsenal. Big changes in trend direction tend to occur quite regularly in the FX markets as well, which means there are plenty of fantastic opportunities to jump on board new movements early in their development if we know what we’re looking for. This is where the power of multiple timeframe analysis comes into its own.
We also need to remember that the dynamics of the currency markets openly allows big trend changes to occur on a regular basis because, unlike stocks, there are always two instruments in every currency pair. Because one currency is constantly being valued against another, this means technically that the price is highly unlikely to ever go to zero and, due to the nature of the theory of reversion to mean, we are more likely to see swings up and swings down on a regular basis. In the stock market on the other hand, the long term trends can last much longer with less exaggerated swings up and down.
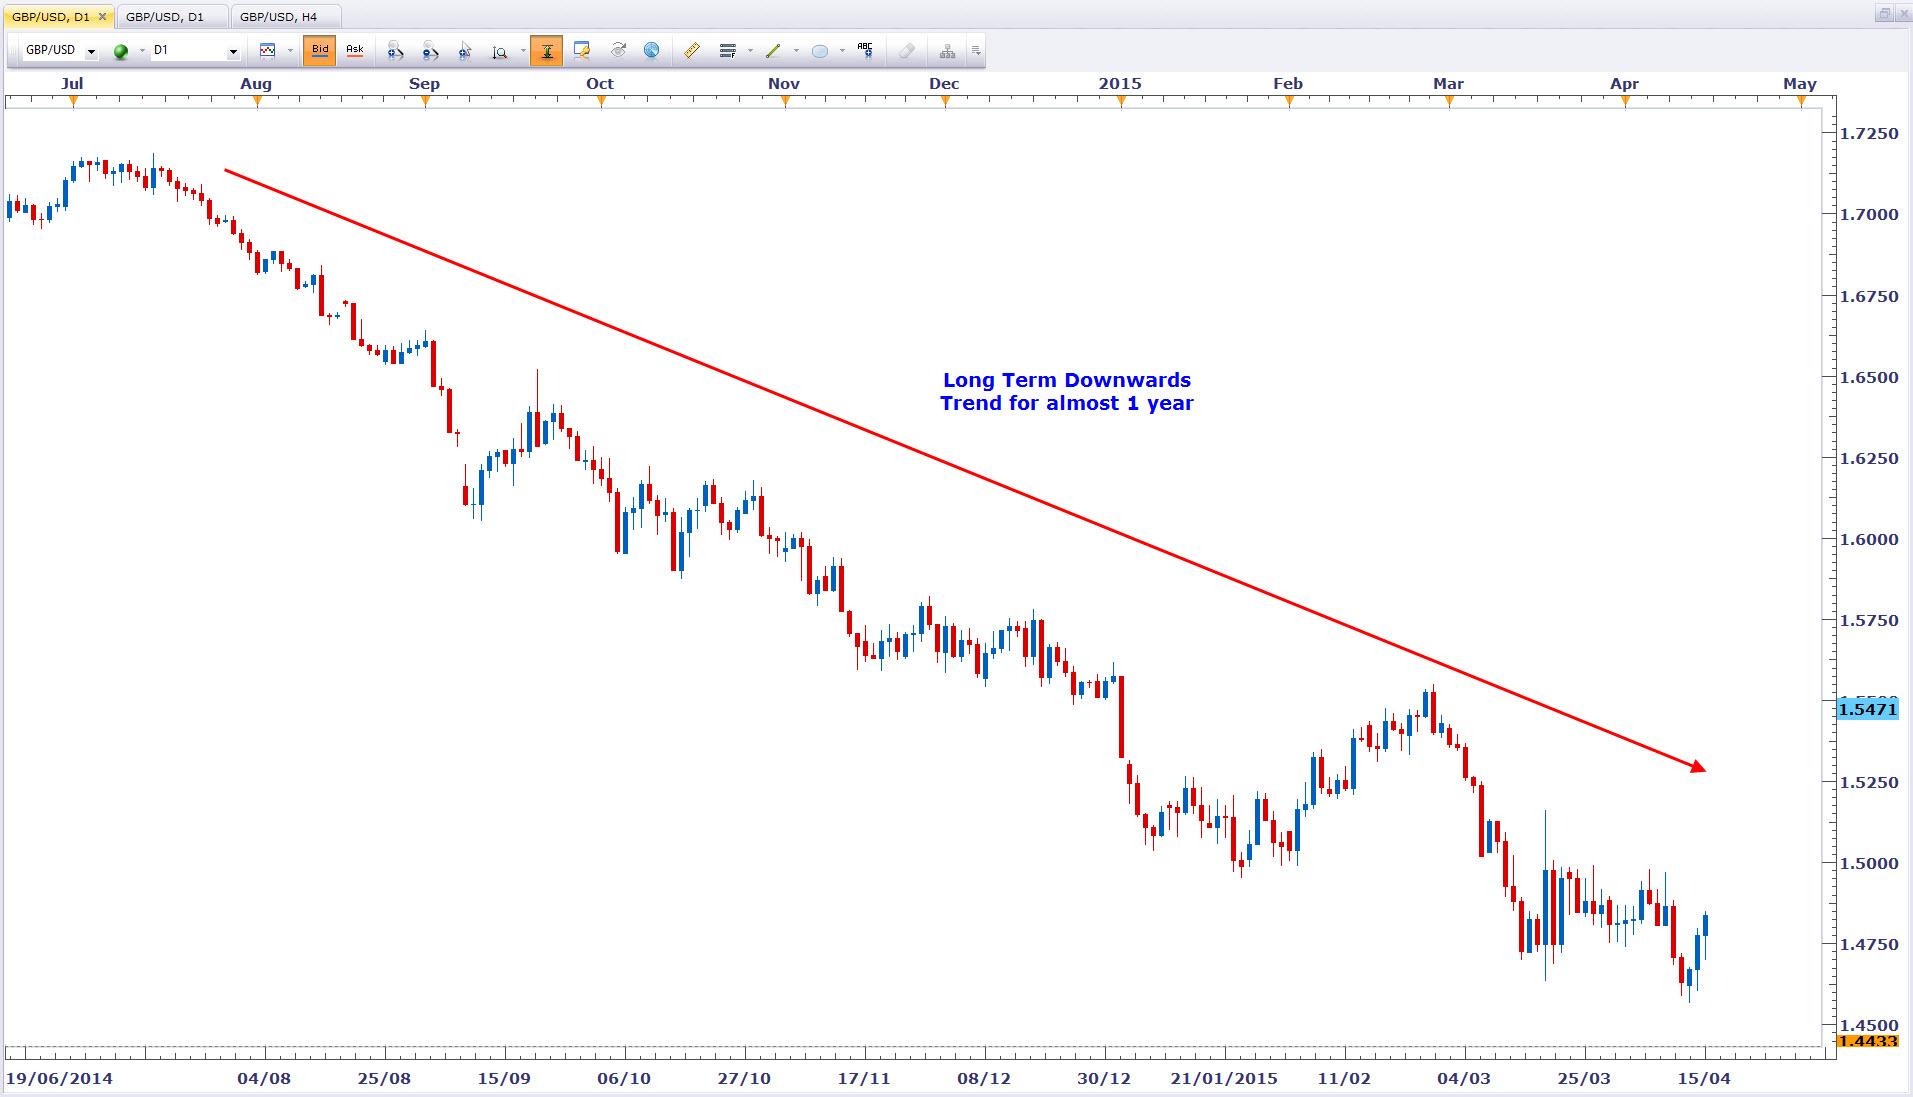
Let us take a look at some recent price action of one of the more popular major currency pairs, the GBPUSD:
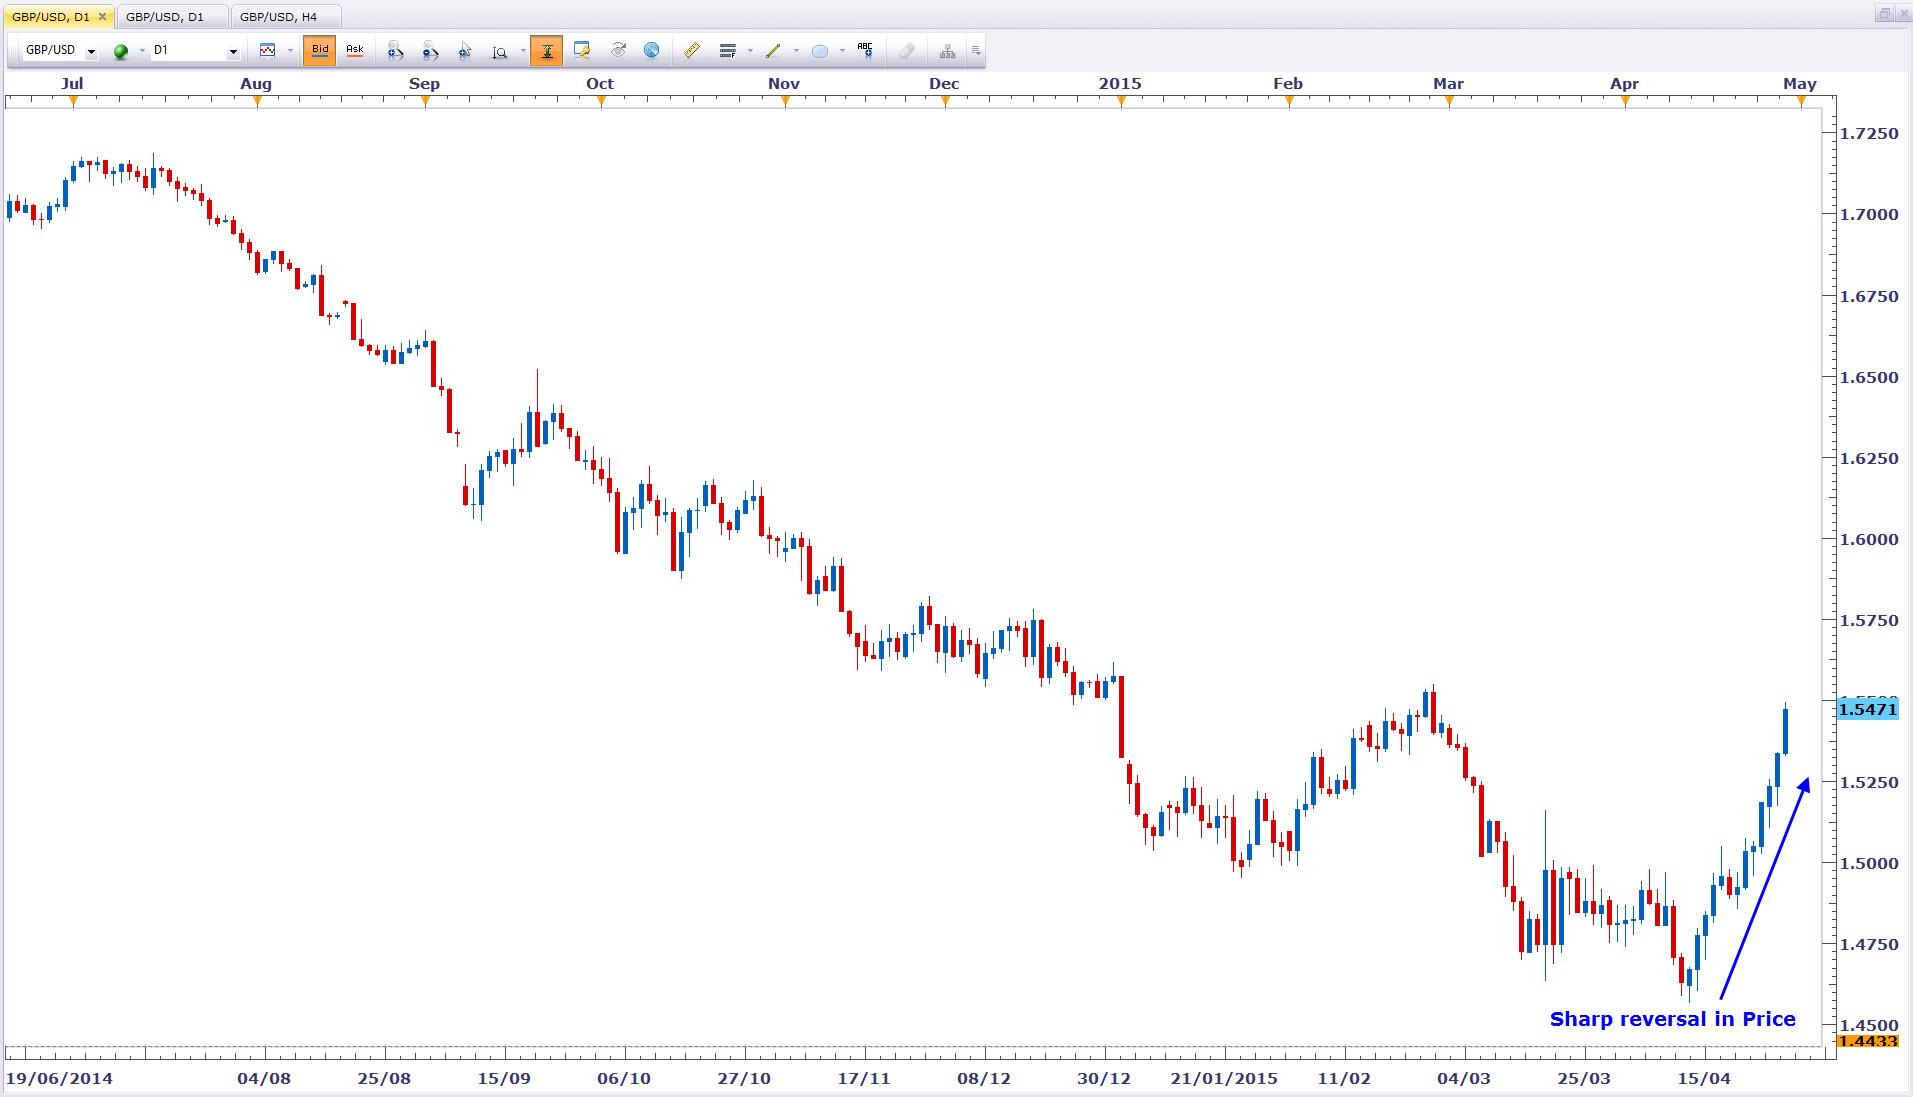
Obviously, we can see that for almost a year now the cable currency pair has been in a long-term downward trend, consistently making a series of lower highs and lower lows. If one was to follow the methodology of traditional technical analysis, they would be looking for trading opportunities which would involve short selling the GBPUSD in an effort to reengage and follow the existing trend. However, the objective and astute trader must also be aware of where a trend reversal is likely to happen as they don’t want to be the last person jumping on board the move. This can actually increase risk and decrease reward. When a trend change does occur it can often be very quick and rather unforgiving as we can see in the below example:
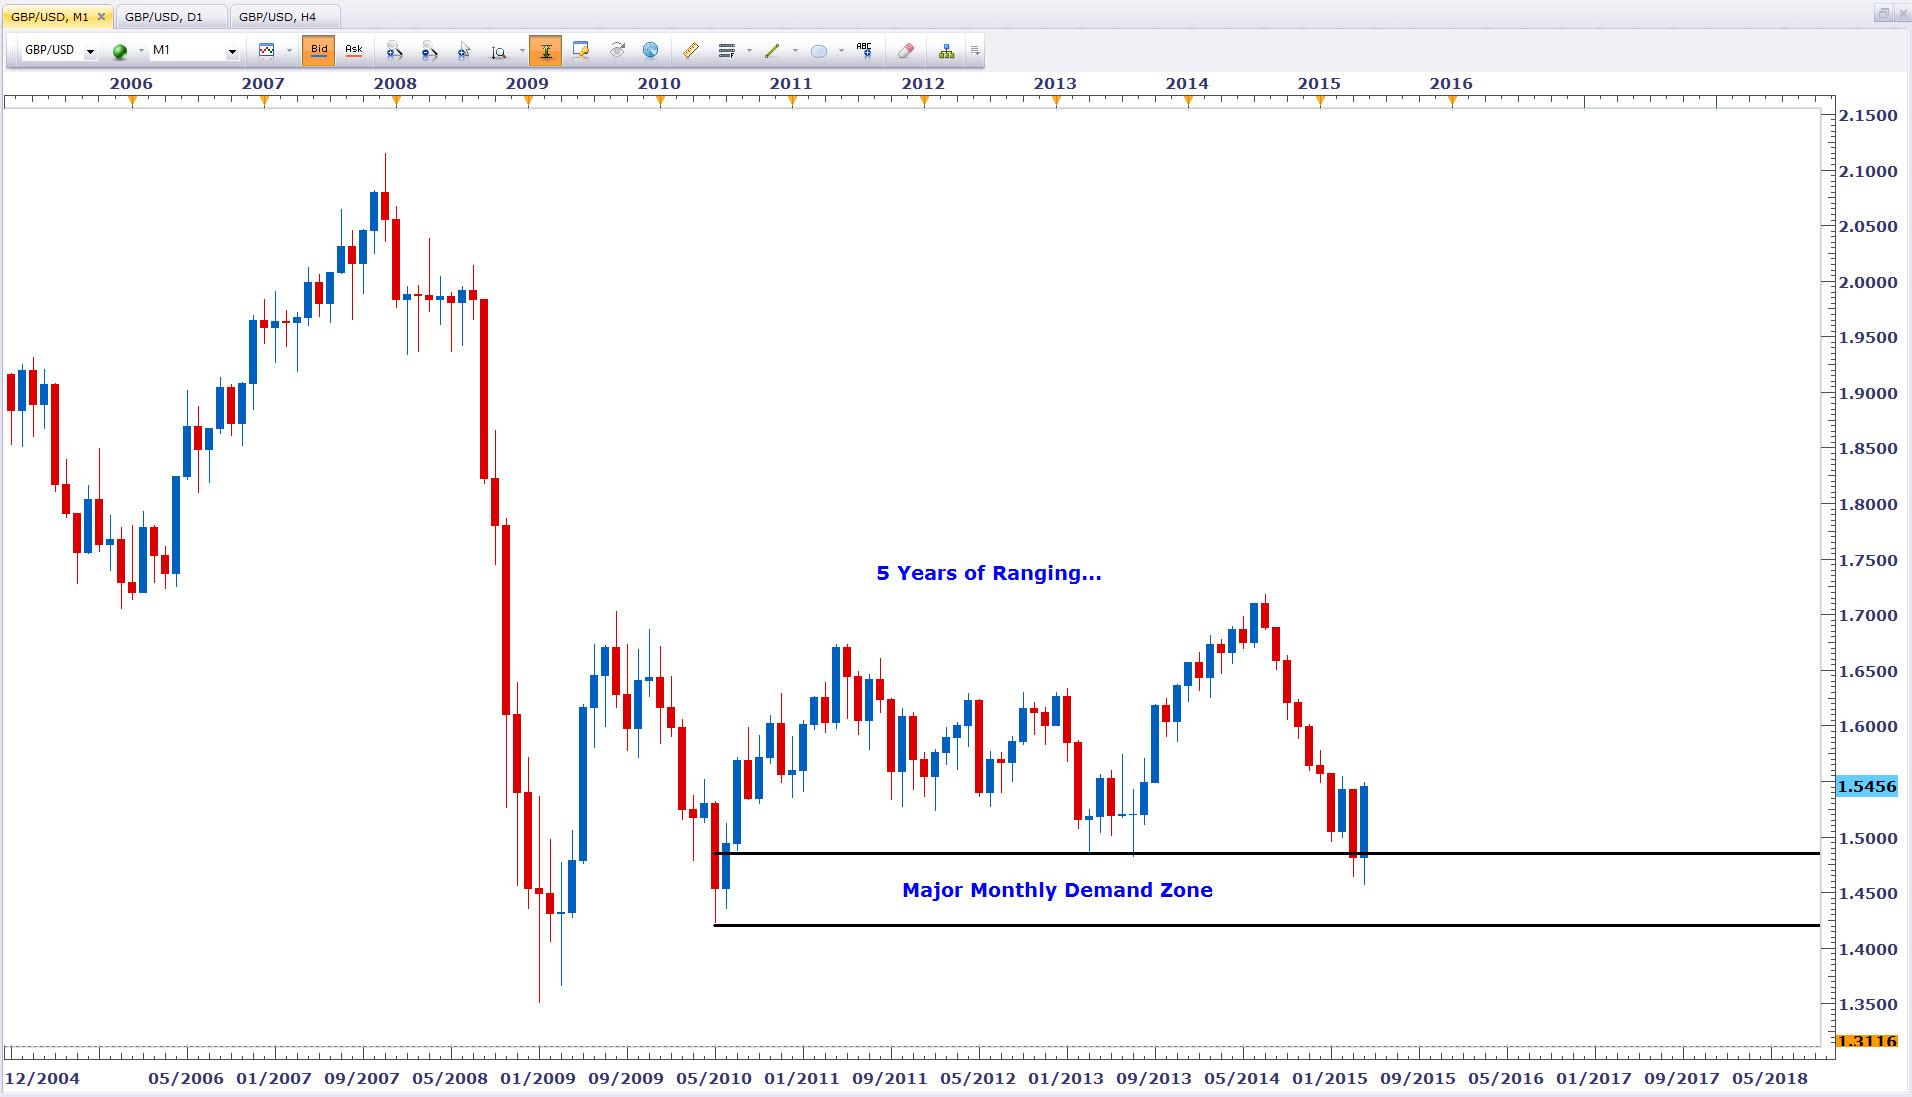
At the time of taking the above screenshot, the GBPUSD had reversed in price by almost 1000 pips in around just two weeks. If you had been following the trend you probably wouldn’t be feeling too confident in that strategy right now. In my XLT session we learned in detail how to anticipate these shifts in price action ahead of time to secure ourselves an edge in the marketplace. Obviously, there is a lot more to identifying these changes in price that can be explained in the context of a short article like this, but to give you an idea of what is involved take a look at the chart below:
Does this make things a little clearer for you? By stepping out and looking at a chart on a bigger timeframe, we shouldn’t really be too surprised right now that a sharp correctional rally in the currency pair occurred. If we remain completely objective, we can see that the GBP USD actually trended down to the bottom portion of a five year range. Until this range is broken we must assume that it will hold, which would suggest more upside potential for the Pound against the US Dollar from where it stands currently. If had only analysed the small time frames we would have completely ignored this possibility.
One of the biggest lessons I learned during my trading education was to never make assumptions. Everything that we see on the news or even on a price chart is the result of something that has already happened. Our job as traders and investors is to analyse what has happened so as to give us an idea of what may happen next. The key is to open our eyes and look at the big picture as well as the small one.
Information on these pages contains forward-looking statements that involve risks and uncertainties. Markets and instruments profiled on this page are for informational purposes only and should not in any way come across as a recommendation to buy or sell in these assets. You should do your own thorough research before making any investment decisions. FXStreet does not in any way guarantee that this information is free from mistakes, errors, or material misstatements. It also does not guarantee that this information is of a timely nature. Investing in Open Markets involves a great deal of risk, including the loss of all or a portion of your investment, as well as emotional distress. All risks, losses and costs associated with investing, including total loss of principal, are your responsibility. The views and opinions expressed in this article are those of the authors and do not necessarily reflect the official policy or position of FXStreet nor its advertisers.