How Practical Are Candlestick Patterns?
|As I have stated on numerous occasions in the past, for me one of the most challenging aspects in attaining consistency as a trader or investor in the markets is simply knowing what works and what doesn’t. It takes time and practice to develop a solid trading plan for your short term income and long term wealth needs and, while you are developing this plan, it is vital to make sure that you keep your risk low enough throughout the process so as to protect your capital along the way. What doesn’t help on top of this is sifting through the sheer amount of information available to us as speculators. As you probably already know, the Internet is a virtual mine field of information which can often lead us astray if we are not careful. There are dozens upon dozens of strategies and analysis methodologies being used in trading today and knowing which one is the right one is key to a trader’s success. In my experience, I try to not think that there is only one way to trade as every different technique comes with its own positives and negatives. As we say, there is no Holy Grail in trading and never will be.
Instead, I suggest that you make it your aim to find the right way for you. A good strategy should be simple to execute and easy to understand, combining low risk of capital and high potential reward for profit. If it becomes too complex, there is the danger of cherry picking your setups and missing the practical and ideal opportunities that the market presents to us every day. Every methodology has its advantages, but unless you use your tools in a practical manner you are unlikely to see the results you so desire. To use an example of this let us take a dive into the world of Japanese Candlestick patterns and their practical use in charting trading opportunities.
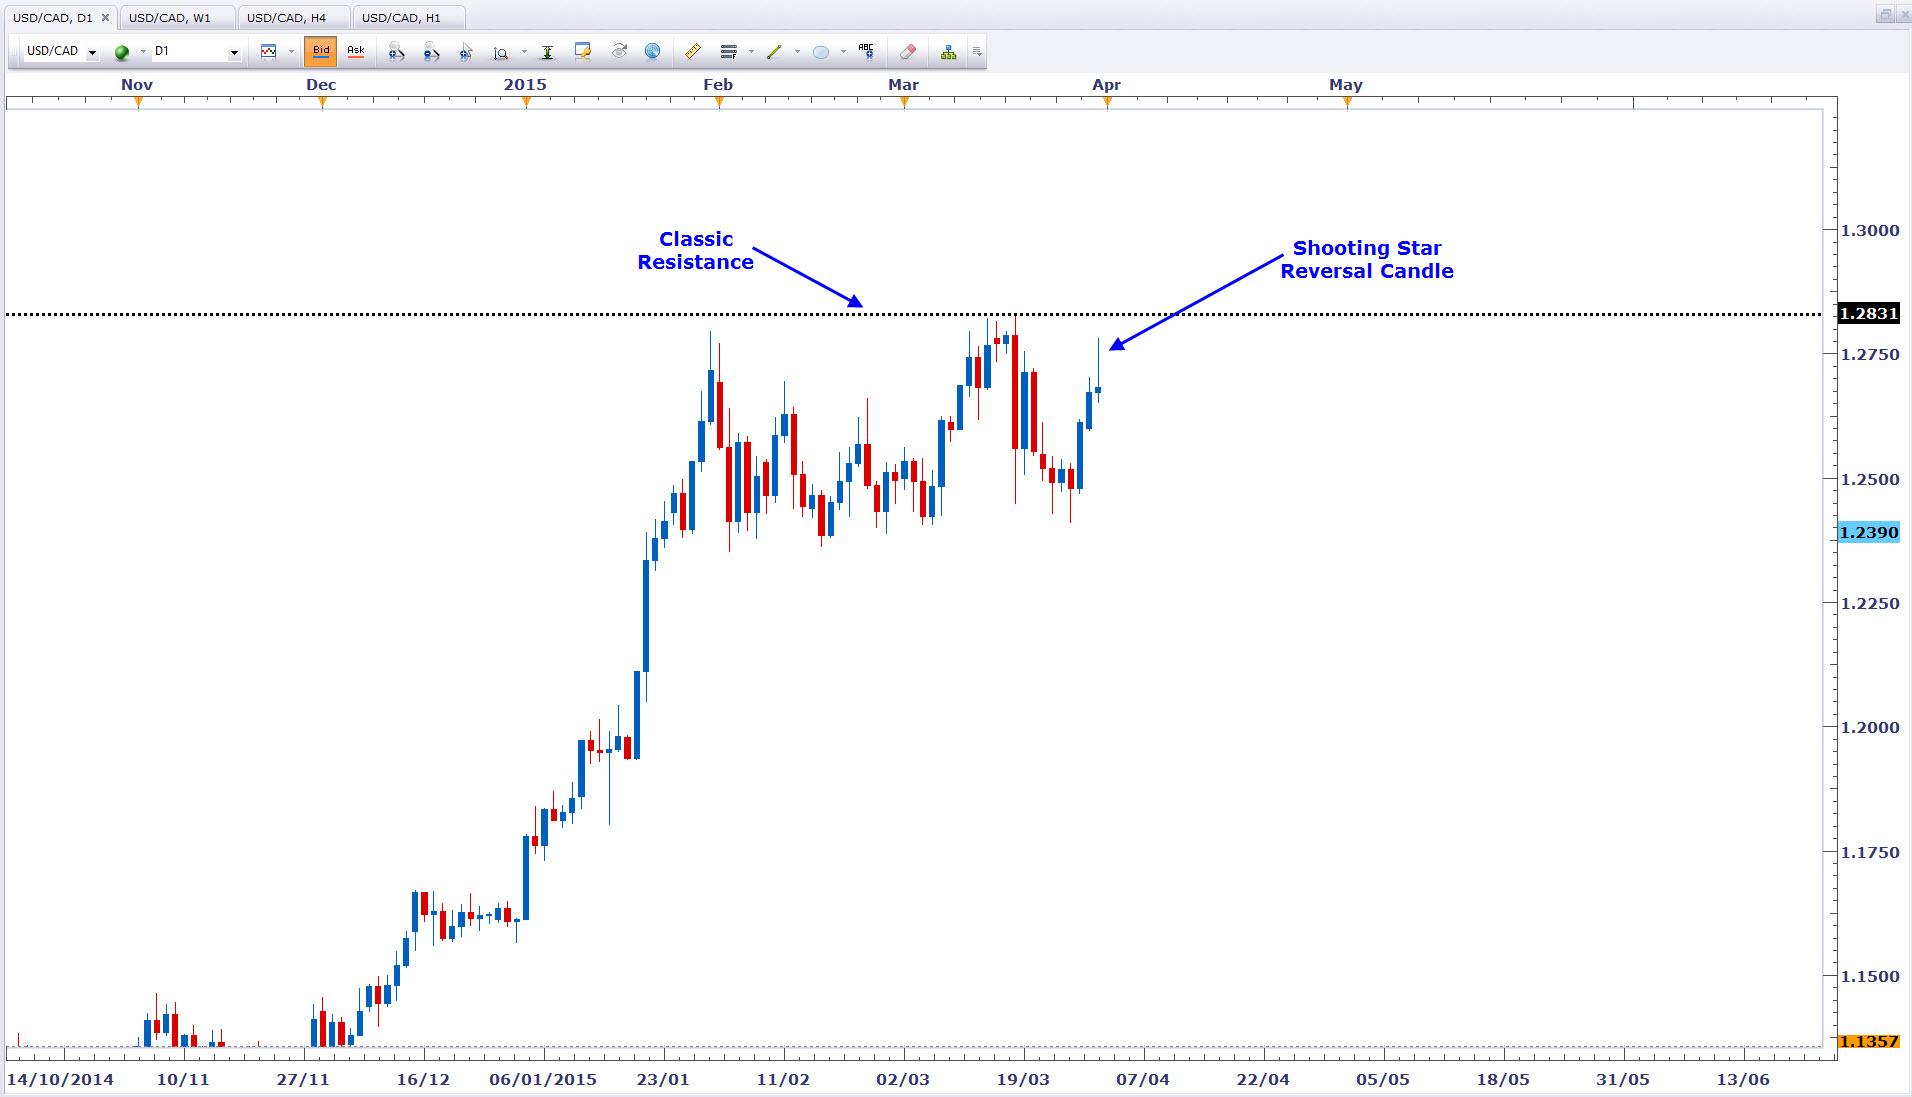
There are many different candlestick patterns used in trading, way too many to list here, with some being more popular than others. However, if you take a good look into the theory behind the patterns, essentially you will find that there are really only two main things the patterns look for. They basically look for either a reversal in the current price action and trend or they look for a continuation of it. Individual candles give us clues to when these reversals and continuations are likely setting up but they also require a confirmation that the change or continuation in price has happened. In the chart example below we can see a potential setup forming with a reversal candle:
In the above chart of the USDCAD, the market has just tested resistance in the 1.2800 region and, as a result, has formed a reversal candle, in this case what we call a “shooting star.” Do you notice the long wick in the upper section of the candle body? This suggests strong selling pressure and gives us a clue that a reversal is in the making. A trader using these patterns in their strategy would be looking to get short on the pair soon. However, this is just a heads up and according to traditional approaches to technical analysis we would now need to wait for the next candle to form and close below the low of the shooting star before initiating the actual short sell of the USDCAD. The next candle, as we can see, gives us that very signal to take action:
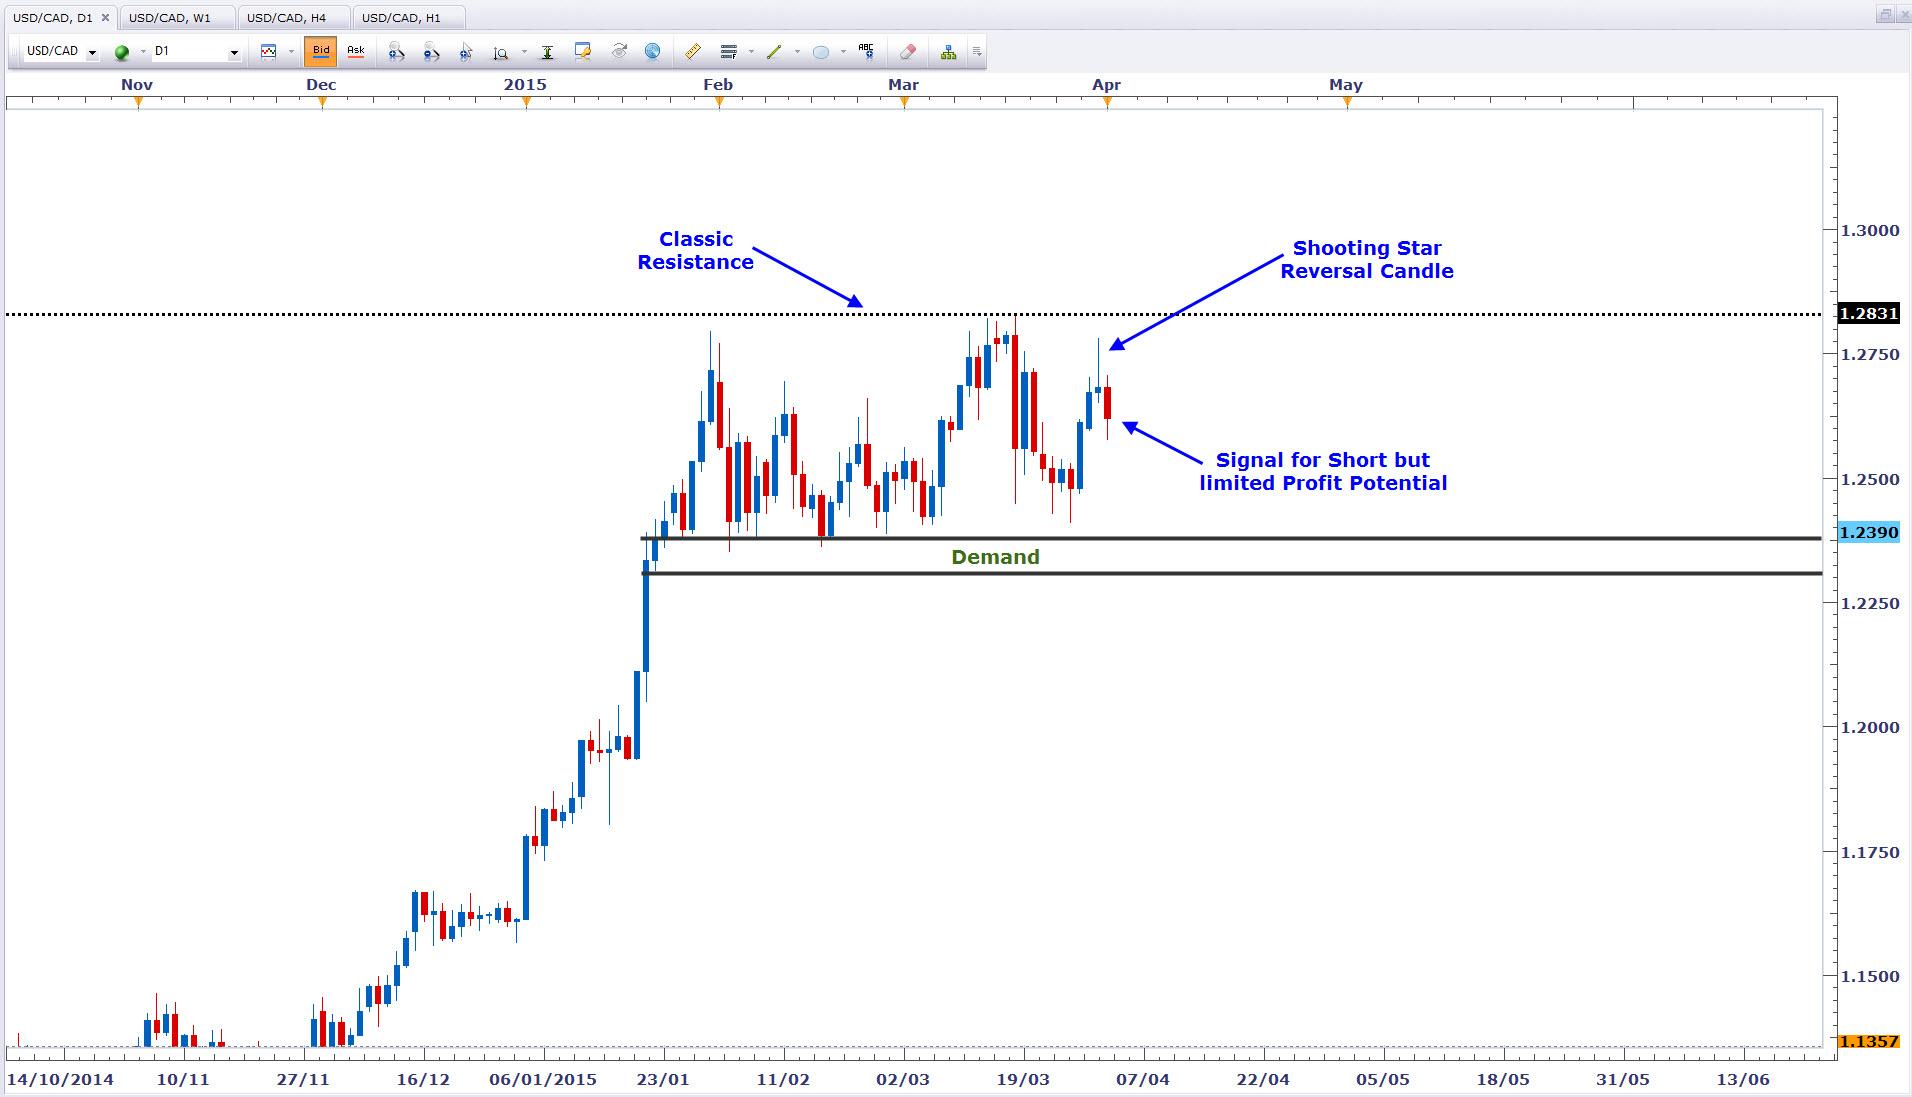
At this point, using this technique we would be allowed to get short on the currency pair but there are a couple of things which must be taken into account. Firstly, the only logical place to have the stop loss would be above the shooting star candle, which therefore increases the risk quite a bit and, secondly, the profit potential is diminished due to the demand zone below at 1.2400 and also because the pair has already moved about 100 pips since the highs of the shooting star. While the trade could still be taken and could work, we must question the practicality of this kind of setup. What if the confirmation candle had closed much lower than the shooting star’s low? This would impact the risk to reward ratio even further and that is not an attractive prospect.
By reassessing this trading opportunity from a different perspective we can see things from a different angle. If we apply the Online Trading Academy Core Strategy principles, along with the candlestick patterns, we see the trade in a different light altogether. Our rules tell us that where there is an imbalance in price we have a trading opportunity in place. When willing Supply exceeds willing Demand, prices must fall and when willing Demand exceeds willing Supply, prices must rise. With this in mind let us look at the chart setup again but this time with our levels of imbalance highlighted as well:
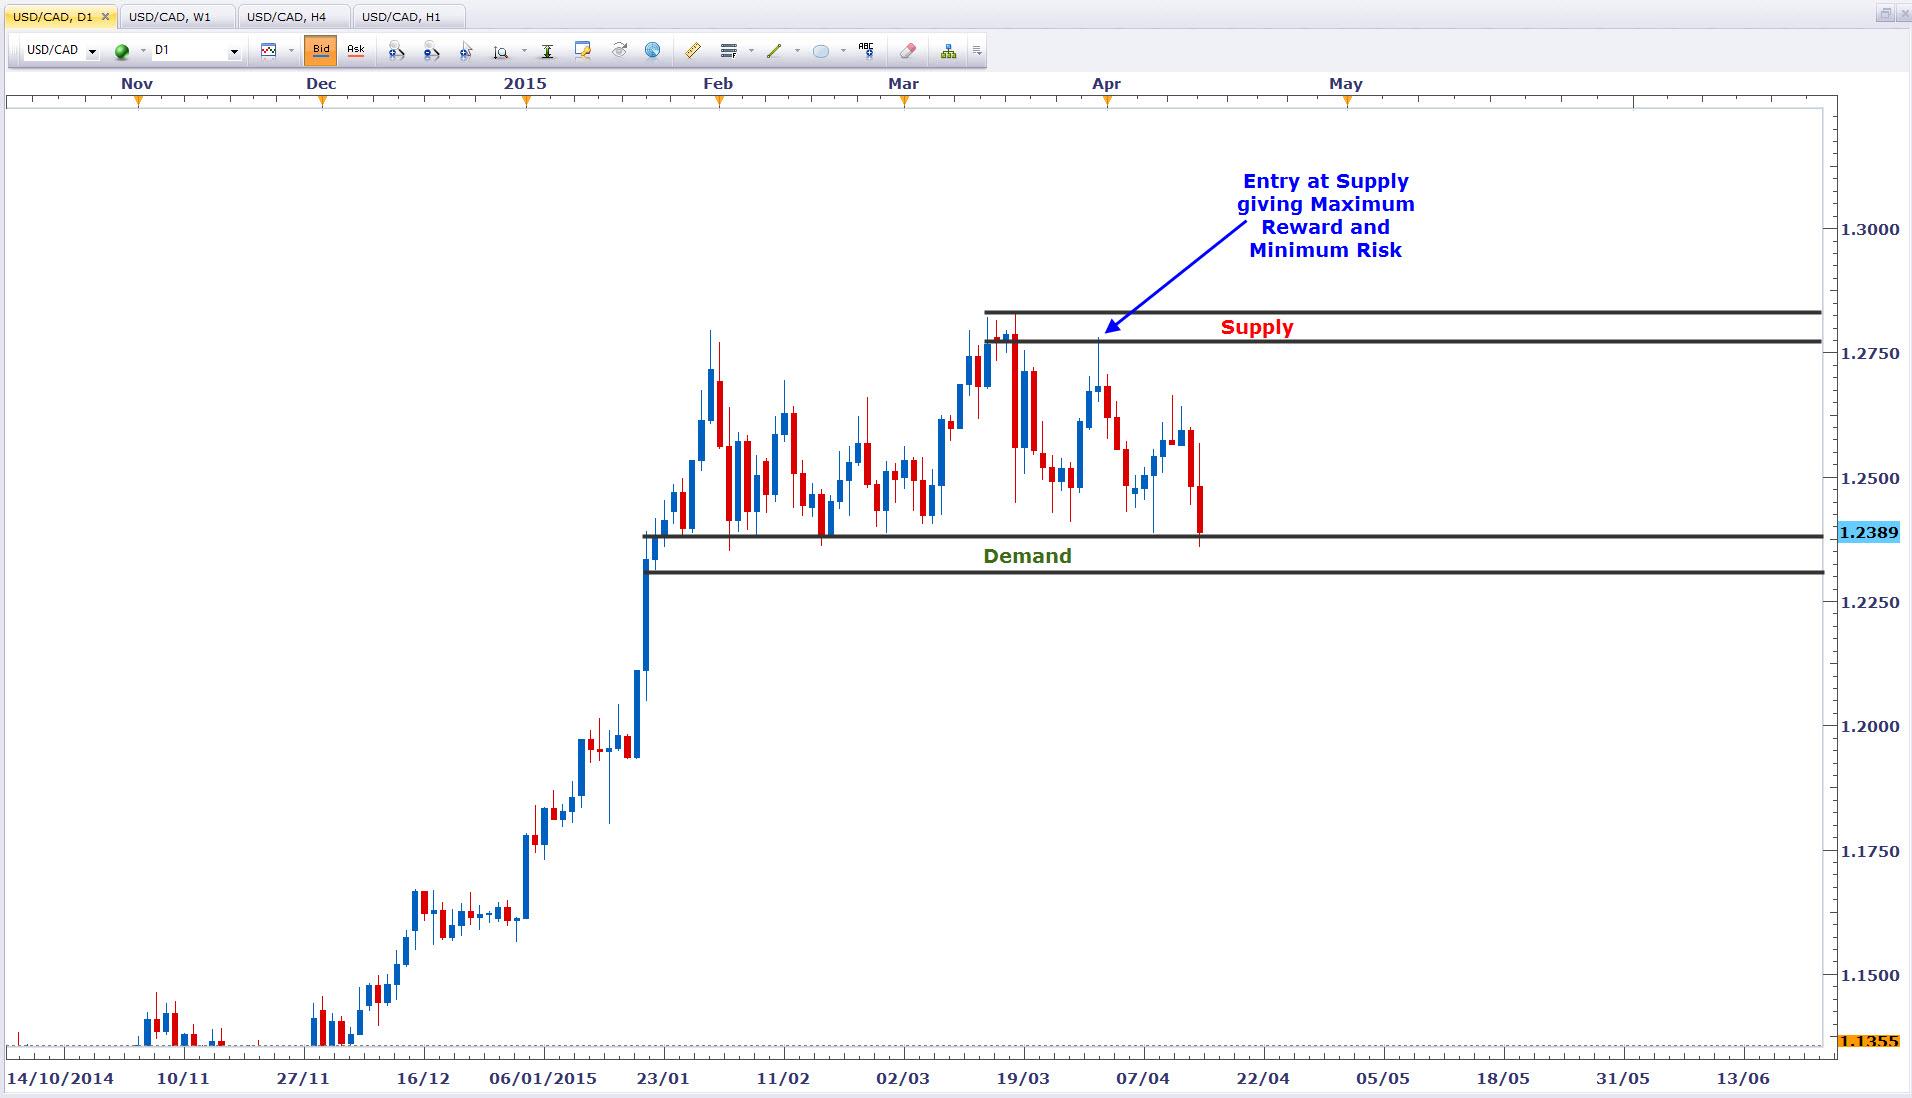
With our zones marked off, do you now see how the market hit the supply level and reacted to it quickly, moving on to then form the shooting star? If the supply zone itself is our risk on the trade, then taking the short as soon as the level was touched means our risk would have been minimal and our reward maximized to its full potential. By waiting for the shooting star to form and then for an entry signal candle, you are entering late into the game, when the trader who took the trade at the zone has already made over twice their risk by entering at the level.
Now some of you may think that the entry at the zone is riskier than waiting for confirmation, but I invite you to consider that even when you have confirmation it does not always mean the trade will work out does it? By entering into the trade at the zone you will always have a better risk to reward profile, and when other traders are waiting for the reversal candle to form, you are already in. In fact, when you see the shooting star form, you would be more likely to give the trade room to breathe and reach your profit target simply due to knowing that other traders are entering based on the candle formation and their actions are likely to help the trade work further in your favour. You can have confirmation and you can have strong risk to reward ratios, but it’s pretty hard to have both. Remember this with any strategy you employ in your trading and always think practically of the implications before putting your own money at risk.
Information on these pages contains forward-looking statements that involve risks and uncertainties. Markets and instruments profiled on this page are for informational purposes only and should not in any way come across as a recommendation to buy or sell in these assets. You should do your own thorough research before making any investment decisions. FXStreet does not in any way guarantee that this information is free from mistakes, errors, or material misstatements. It also does not guarantee that this information is of a timely nature. Investing in Open Markets involves a great deal of risk, including the loss of all or a portion of your investment, as well as emotional distress. All risks, losses and costs associated with investing, including total loss of principal, are your responsibility. The views and opinions expressed in this article are those of the authors and do not necessarily reflect the official policy or position of FXStreet nor its advertisers.