Speeding Through the School Zone of Forex Trading
|Hello traders! This weeks’ newsletter will discuss the difference between support/resistance traders and supply and demand traders.
In every Online Trading Academy class that I teach, be it a five day futures or forex class or a three day Market Timing class, I always bring up the fact that trading is similar to driving a car. Both endeavors require you to pay attention, look for certain patterns, follow certain rules, etc. etc. In trading, the worst that can happen is that you lose a bit of money; obviously, in driving, the worst that can happen is you or someone else can die. Follow the rules and the likelihood of either event goes down.
When learning to drive you are given certain rules of the road. Break them, and nothing might happen to you, or you might lose your license, get thrown in jail, or hurt yourself. As stated in other newsletters, everything in life is a trade. Everything has a reward to risk ratio! Speeding through a school zone might save you a few seconds as reward, but the risk is losing your license or going to jail. What happens if you meet someone who says that they speed through school zones every day and never get caught? “Ah,” the inexperienced driver says, “Speeding through school zones must be easy and, therefore, the way to travel.” I would imagine the first driver was either a liar, or perhaps extraordinarily lucky. Of course, we wouldn’t be speeding through school zones as a habit!
So how in the world does this apply to trading? Here at OTA, we believe that price action turns where unfilled institutional orders (supply and demand) lie in wait for the candles/price action to return. Most traders out there rely on the old support and resistance technique – which occasionally works! Much like speeding through a school zone occasionally works. Let’s look at a few examples on the following chart:
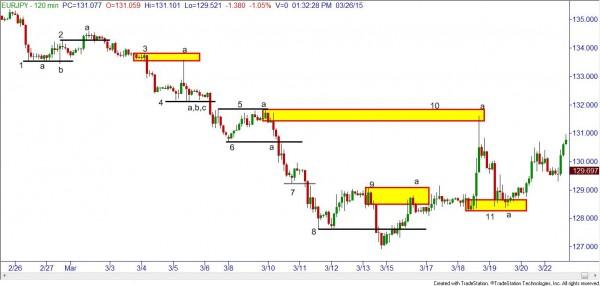
Starting on the left side of the chart, each line will represent a support or resistance trade, with corresponding letters defining what happened on possible trades. Any supply and demand zones will be marked with yellow boxes, also with corresponding letters on what could have happened. Let’s begin:
Line 1, drawn as support from point “a;” if a trade was taken at point “b,” a small loss would have been taken if the trader had their stop just under the line 1.
Line 2, drawn as resistance from the beginning of the line; if a short was taken, the next time price got to line 2 a loss would have been taken if the stop was just above line 2.
Yellow box 3, marked as supply; a short could have been taken at point “a,” obviously a winning trade.
Line 4, drawn as support from the start of the line; possible trades at “a,” “b” and “c;” trades at “a” and “b” may have been very small wins; “c” would have been a small loss.
Line 5, marked as resistance from the beginning of the line; short at point “a,” congrats, a good winning trade! Sometimes speeding works…
Line 6, marked as support with long trade taken at “a;” small loss.
Line 7, support, small loss.
Line 8, support, good winner, then a loss. Ever hear of the phrase, “What was once support becomes resistance and vice-versa?” Many a new trader would have taken the first long and made money. The second time price got to line 8 they would take the same long trade and lose money. When price came back up to line 8 they would have shorted for a loss. Ouch! This job is kinda tough.
Yellow box 9, marked as supply, short entered at “a.” This is a tough one as you can see the trade would have not hit any 3:1 reward to risk ratio. However, it spent so much time hanging around your entry price without moving that you should have broken even on this trade; but so it doesn’t look like I am stacking the deck we’ll call it a loss.
Yellow box marked 10, short at point “a.” Easy winner, should have made at least 5:1.
Yellow box marked 11, long at “a.” Good winner, slow to get going but should have made money.
Let’s be honest folks, there were many more support and resistance lines I could have drawn in; but I was getting a little depressed on all of the losses that were mounting up. I meet unsuccessful traders every week; that’s why they are coming to class! We know what doesn’t work; we see and hear it every day! Notice the number of quality supply and demand zones marked on this chart vs. all of the potential support and resistance trades. I would rather trade less and make more money, than trade frequently and not make money. I recommend that you try this exercise yourself with your own platform. Mark out the many support and resistance lines that you might trade from and see how they held up. Now mark a few quality supply and demand zones and see how they held up. If you are doing it right, you should notice that you would be trading less, would be right more often, making more money with less stress. Not a bad way to drive, right?
Information on these pages contains forward-looking statements that involve risks and uncertainties. Markets and instruments profiled on this page are for informational purposes only and should not in any way come across as a recommendation to buy or sell in these assets. You should do your own thorough research before making any investment decisions. FXStreet does not in any way guarantee that this information is free from mistakes, errors, or material misstatements. It also does not guarantee that this information is of a timely nature. Investing in Open Markets involves a great deal of risk, including the loss of all or a portion of your investment, as well as emotional distress. All risks, losses and costs associated with investing, including total loss of principal, are your responsibility. The views and opinions expressed in this article are those of the authors and do not necessarily reflect the official policy or position of FXStreet nor its advertisers.