Managing Your Stop Loss in Trading
|Hello traders! Recently I was having an email conversation with an old student about his trading. His questions and comments led to this newsletter where we will discuss a few rules on how and when to manage your stop when you are in a trade.
“Bill’s” main question centered around trading near news events. He stated that he would be in the money sometimes as much as two times his risk, yet a news event would reverse the markets direction and he would get stopped out. Bill informed me that he was trading from a daily, four hour, and 60 minute series of charts, making him a swing trader (someone who expects to be in trades for a few days at a time.) He remembers that we recommend against trading around big news events, but from his time frames, he couldn’t help but be in trades when news comes out. In my humble opinion, the only news events I won’t trade around are interest rate decisions which come out about every 6 weeks for the U.S.- FOMC, and Non-Farm Payroll/Unemployment rates which come out usually the first Friday of the month. Other than those, I’ll more than likely stay in my trades through the news events. So the main lesson from this is that swing traders will have to be in trades when many of the news events come out.
The next problem Bill had was he left his stop loss in the money-losing, risk management stop loss throughout his entire trade, even when the chart had been going his direction. There are a couple of “industry standards” as far as when to move your stop to break even, essentially giving you a “free trade” where you will probably not lose any money even if price reverses. The first industry standard is when you are in the money the amount of your stop, move your stop loss to break even. So, if you had an original stop loss of 30 pips, when you are in the money 30 pips you may move the stop loss to break even for the free trade. Now, everything in trading has its good things and bad things. The good thing about moving your stop loss this early is that you will take fewer losses. The bad thing is that you may get stopped out, yet the chart might still go your direction, and you will be watching it go your direction but have no position on!
The second industry standard is to move your stop loss to break even when you are in the money two times your stop. So, if the original stop was 30 pips, you would wait for price to get you in the money 60 pips before moving the stop to break even. The good thing is that you will stay in more winning trades, the bad thing is that you will take more losses. Every trader must determine what technique fits their personality best. My own rule is I have to wait for price to be in the money 1.5 times my stop loss before moving to break even.
In previous newsletters we have discussed manually moving your stop when the price action is moving your direction, often called a technical stop. In my opinion, this technique will make you the most money over time, however, it is also the most labor intensive. But what about the mechanical trailing stop, or just letting the machine do the work? Again, this has both good things and bad things. The main good thing is that you don’t have to be around your trading computer to manage your stop loss, the machine will lock in profits for you! The main bad thing is that one quick move in your direction may drag your stop loss to a technically silly location on the chart, stopping you out with the trend is still intact.
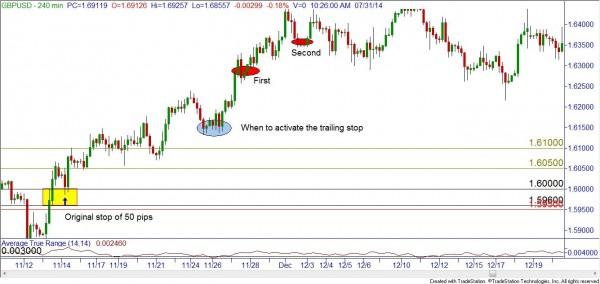
In the following GBPUSD four hour chart, the blue arrow represents a potential long entry in a demand zone. Your original stop loss would go below the zone a few pips, in this example a 50 pip stop loss would be set at 1.5950 if your entry was at the top of the zone at 1.6000. Using the first technique discussed earlier, you could move your stop to break even when the price hit the first gold line of 1.6050. The second technique is at the higher gold line of 1.6100.
My own rule of thumb is that I won’t use the mechanical trailing stop until I am in the money at least two times my stop loss. However, I don’t do this automatically at that level. I need to wait for price to actually pull back before I turn on the trailing stop. For the sake of clarity, I marked on the chart with a blue oval what I need to see before I will turn on this style of trailing stop. When in a long trade, I won’t turn on the trailing stop when price is at a peak; you would expect price to retrace, wouldn’t you? I need to see a small move in the opposite direction of my trade. In this example, the five red candles went against the long trade indicating a pullback. Sometime in the blue oval, as price was basing, the trailing stop can be activated.
How much of a trailing stop should you use is the next logical question. Again, some industry standards for you: use a multiple of the ATR (average true range) of your middle time frame. The common multiples are 1.5x, 2x, or 3x the ATR. At the time of the basing candles in the blue oval, the ATR is approximately 30 pips. So applying a trailing stop loss of 45, 60, or 90 pips would fit our criteria. In the previous chart, the first red oval is where using the first two multiples of the ATR would have taken you out of the trade, and the second red oval is where the third ATR multiple would have taken you out.
There are a few more things to be aware of when using a trailing stop, but those extras are better discussed in one of our classes.
So there you have it. A couple of rules as to when to move your stop, and another way to manage a trade when it continues to go your direction. Hope this helps both you and Bill!
Information on these pages contains forward-looking statements that involve risks and uncertainties. Markets and instruments profiled on this page are for informational purposes only and should not in any way come across as a recommendation to buy or sell in these assets. You should do your own thorough research before making any investment decisions. FXStreet does not in any way guarantee that this information is free from mistakes, errors, or material misstatements. It also does not guarantee that this information is of a timely nature. Investing in Open Markets involves a great deal of risk, including the loss of all or a portion of your investment, as well as emotional distress. All risks, losses and costs associated with investing, including total loss of principal, are your responsibility. The views and opinions expressed in this article are those of the authors and do not necessarily reflect the official policy or position of FXStreet nor its advertisers.