It's All About The Oscillators
|
As a regular author of these articles, I consistently discuss about the importance of focusing on the key elements of trading before focusing your attention on anything else. From the Technical Analysis perspective, I prefer to base my trading decisions primarily on the ongoing dynamics of Supply and Demand. For me, this is pretty much the most objective analytical approach available, mainly due to the simple fact that the very best indicator of where price is likely to go next, is price itself.
However while this approach formulates the core strategy of what we teach our students worldwide here at Online Trading Academy, I also deeply respect a handful of the other technical tools and analysis methods that are widely available to traders of all skill levels. Sure, I would never just take a trade based purely on a buy or sell signal generated by a technical indicator alone, but with this said, these tools can provide a powerful role in aiding the overall market analysis process. As traders, we simply need to understand that there is absolutely no such thing as a leading indicator. There is no perfect trigger available and until machines can consistently predict the future, then things are unlikely to change anytime soon.
I have found in my experiences as both a trader and a teacher of others, that while there are a huge selection of technical indicators built into most quality trading and charting platforms, after time experimenting with them all, it becomes clear that where most are concerned, they can be divided into two separate categories: Momentum based and Oscillator based, with the former more widely used for the most basic buy and sell signals. Occasionally, when a dominant trend is in place in the marketplace, just relying on Supply and Demand levels alone, means that much of the trend is lost to the trader, thus forcing them to sit on their hands and wait for a better time to enter the market at a more extreme level. However, by using an oscillator from time-to-time during these scenarios, the objective and patient trader can often be given a chance to step into the trend, ideally when looking to short rallies in downtrends, or buy pullbacks in uptrends.
The most common of the oscillator family of indicators would include the likes of the RSI (Relative Strength), the CCI (Commodity Channel Index) and Stochastics. I have worked with and continue to teach my students in the Online Trading Academy classroom and ongoing Extended Learning Track (XLT) Graduate Program the benefits of these tools when used in the right circumstances. The oscillator anyone chooses to use, is really entirely up to personal taste, but I would never recommend using more than one at a time purely for the reason that in essence all three do exactly the same job. While the RSI is formulated based on relative strength of price, the Stochastics is instead based on systematic higher and lower price closings. The CCI computes its results from the change in price in comparison to previous price fluctuations. So, while each individual indicator has a slight difference in its calculation method, they all have the common thread of showing a trader signs of when a market is potentially “overbought” or “oversold,” leading to some key potential opportunities to join the current trend.
Each indicator is formulated from the price data itself, so we must always remember that often the indicator can give us a very late entry signal, therefore, increasing the risk and reducing the reward potential of the trade. There is, though, a solution to this problem and that resides with the actual amount of price data the indicator is programmed to work with. You see, no matter the technical tool to be used and its own bespoke method of calculation, they all need a certain amount of price data to function. This setting can often be found described as the period of length setting, dependent upon the charting software being used. Typically, the default setting is the original amount of data used for the calculation, as was first intended by the indicator’s creator or designer. As a rule of thumb, I encourage students to use the default setting when working with an indicator of any kind, as this was the original setting employed by the tool’s creator and is a good average to work within. We can, however, change the period setting at will, either speeding up the amount of entry signals given by the indicator, or instead adding more periods to provide fewer buy and sell triggers.
Changing this setting comes with its own pros and cons as we can see in the example below:
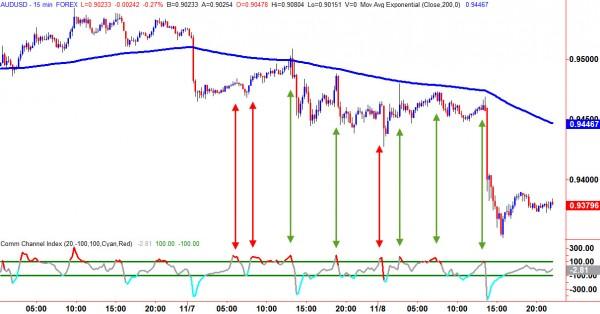
Here we have a 15-min intraday chart of AUDUSD in a downtrend, with a simple CCI indicator applied and using the default setting of 20 periods. An objective method to define the trend is to apply a 200 period Moving Average and if prices are above we look for buy signals and if prices are below it, then we look for sell signals. As we can see, during the price fall there were a number of rallies which gave us overbought sell triggers on the CCI. Using the simple rule-based method, the trader had some solid opportunities to get involved. However not all the sell signals were good ones. The failed signals are marked in red and the successful in green. This is why it is so important to keep the losses small and the wins big. Now let’s go to a chart with the CCI applied using the faster setting of a custom 7 periods:
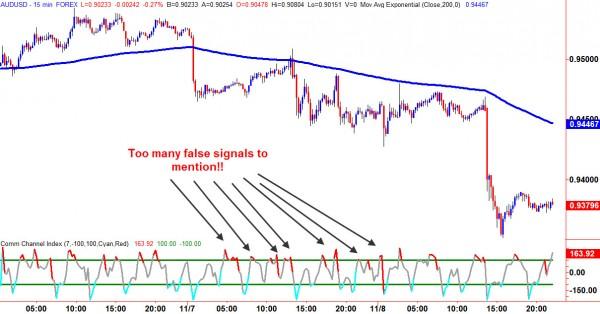
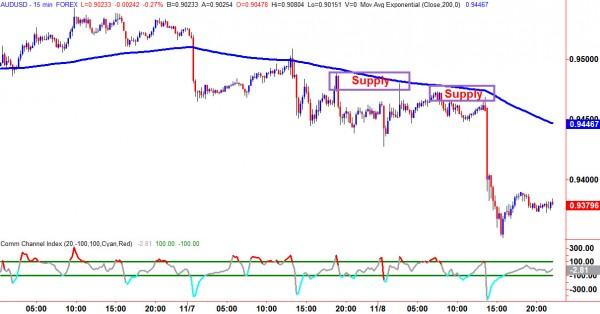
In this example, we can see that while the CCI did give us winning entries, it also gave many more false signals as well, inviting the trader to enter the market short prematurely and resulting in being chopped to pieces before the price went lower. The advantage of speeding the indicator periods up does provide a trader with the chance to get closer to the action on occasion, but the fact that the CCI is using less data, it is, therefore, giving more signals with less probability. On the other hand, the 20 period setting misses out on some earlier entries, but with fewer triggers it also saves the disciplined trader a run of losses during the ranging period. However, with a solid understanding of Supply and Demand levels in conjunction with either setting of CCI, gives us far better results, as we can see in the below example:
Think of the difference between the 7 period setting and the 20 period setting like comparing the time it takes for a sports car and an articulated truck to perform a U-turn…one can do it in the flash of an eye making it hard to see what’s coming, while the other goes at a slower pace allowing you to follow the action with plenty of time to observe. The most important lesson of the day though, is that either signal will always be a better one if used in conjunction with the laws of Supply and Demand.
Information on these pages contains forward-looking statements that involve risks and uncertainties. Markets and instruments profiled on this page are for informational purposes only and should not in any way come across as a recommendation to buy or sell in these assets. You should do your own thorough research before making any investment decisions. FXStreet does not in any way guarantee that this information is free from mistakes, errors, or material misstatements. It also does not guarantee that this information is of a timely nature. Investing in Open Markets involves a great deal of risk, including the loss of all or a portion of your investment, as well as emotional distress. All risks, losses and costs associated with investing, including total loss of principal, are your responsibility. The views and opinions expressed in this article are those of the authors and do not necessarily reflect the official policy or position of FXStreet nor its advertisers.