Level To Level Trading
|
Over the last few weeks worth of articles I’ve taken a fresh approach to some of the classical forms of analysis. We have looked at some practical uses of tools such as moving averages and trend lines, in ways that can help us as objective traders using price action first and foremost, as a reason for entering the market. I said it then and I’ll say it now, always use price as your primary reason for taking a trade and only then is it okay to use another technical tool to help confirm that the opportunity is a good one. However, I have found over my years of teaching that when I introduce students to our core strategy, they rarely ever want to use any of the other tools on top of it. This is because price gives them the clearest picture of the market and allows them to set their stop losses, targets and entries without emotion and with controlled discipline.
It is for this reason that in the Online Trading Academy classroom, we focus on the core strategy above all else. We look objectively at the price chart to recognise opportunities where imbalances are present between supply and demand. When these imbalances are present, we call this a supply or demand level. These levels give us our entries and our risk management parameters of the trades available. When teaching students about the supply or demand zones in the first instance, we show them how to define the entry above all else and what picture we specifically look for on the chart. By looking to the charts to find where the greatest imbalances are between the institutional buyers and sellers, we can then get a very good idea of where we want to enter the market when price returns to that area.
As is often the case though with traders and those who are learning new techniques in the market, they get very caught up in finding an entry, but rarely think about the all important exit as well. Think about this for a second: what is the point of getting into a trade if you have no idea how to get out of it for profit as well? The stop loss, well that kind of takes care of itself but the profit target can sometimes be the most challenging aspect of all, which is ironic considering that we are trading to make money in the first place and we often forget how important it is to have that profit objective.
So in answer to that question of “where do I put my profit target?” the simple answer as always is back in the price chart itself. The beauty of using supply and demand levels to find our trades, is that they also help us in finding out the targets and stop losses as well. Let’s take a look at an example:
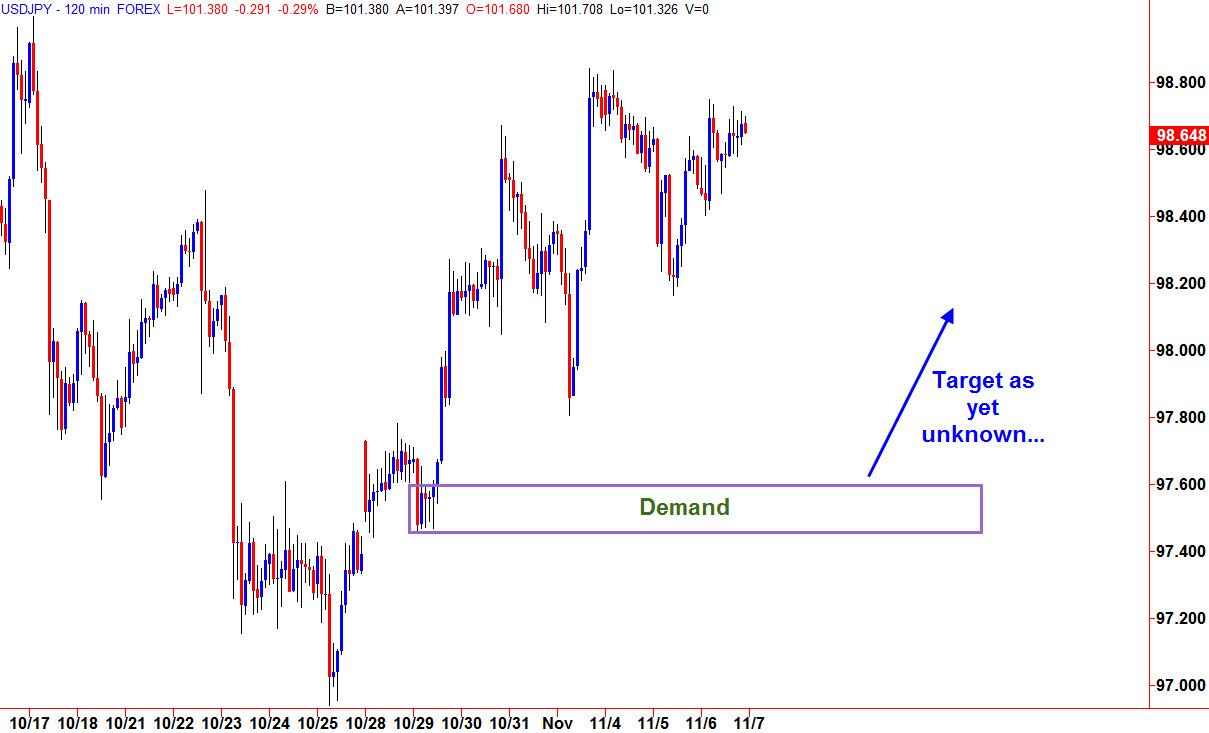
This is a common swing trading set up on a two hour time frame of the USD JPY currency pair. Anything from a one hour chart up to a four hour chart is ideal for set and forget swing trading in the world of FX. You can see in this example that we have highlighted a lower area of demand in the price region of around 97.50. This area is attractive to us because clearly there was a large imbalance between the willing buyers and the willing sellers which resulted in a strong move away in price to the upside. Clearly somebody with larger pockets than mine was trying to buy a lot of dollars at this particular price. That means I want to be first in the queue to buy some if the price comes back to that area in the future. We would like to take an entry at the top section of the demand zone and use the lower section as a guide for placing our stop loss below, in case we are wrong on this buying opportunity. At this point in time I know where I want to buy and I know where I want to be out if I’m wrong. The only question left unanswered is what will be my profit target? Give it some more time and we can find out. Let’s take a look at the next chart:
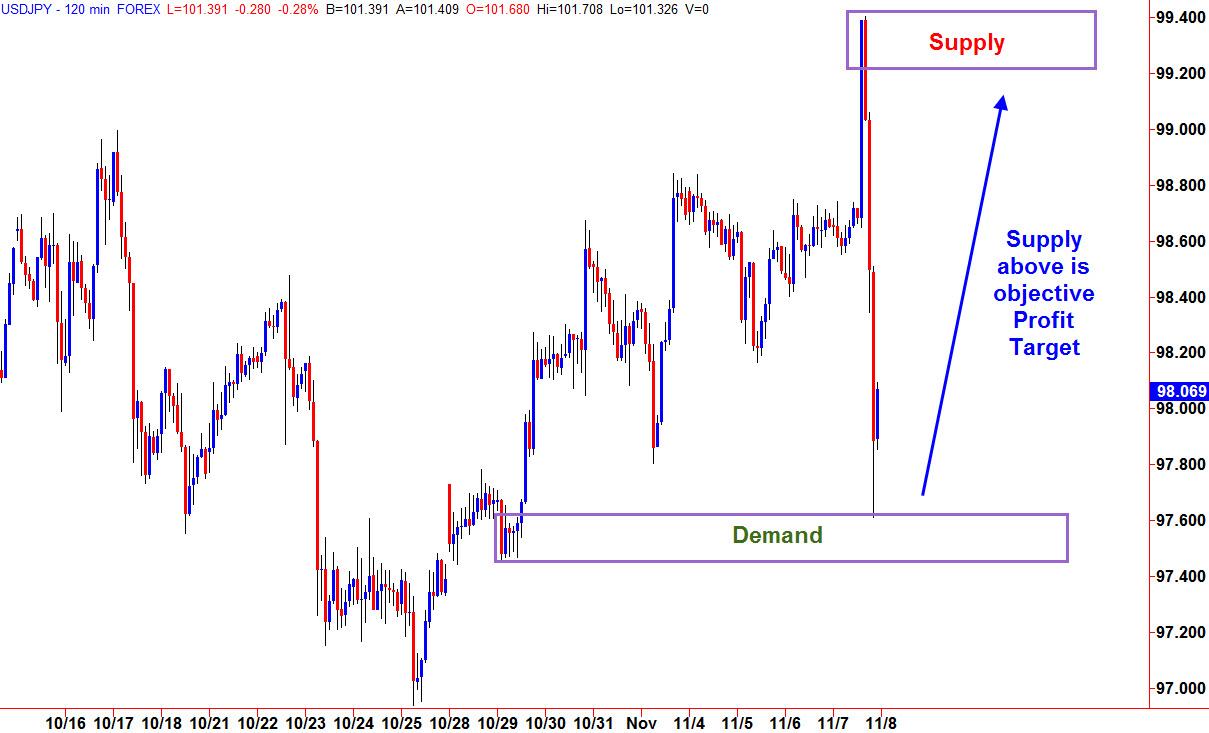
One of the practices which a swing trader needs to get used to, is having patience. It can often be difficult to wait for a trade to come to you but as we can see in this chart, this buying opportunity was triggered the very next day and we didn’t need to be there at the moment it triggered either, because this can all be set up on our trading platform in advance. Now the question is where are we going to get out for profit? Well, let the chart tell you. Notice how we had a very impulsive and strong move to the down side from an area of supply around 99.30? When this drop happened, there were no more other pockets of willing sellers along the way, suggesting to us that the price should not have too much difficulty getting all the way back up to at least 99.00, assuming the area of demand holds. This trade now offers a very attractive reward to risk ratio profile.
To some this may look like an ambitious profit target, however to our students this is a concept known as the path of least resistance. Some people refer to price having memory and this is that dynamic in play. If the price chart is not telling me that there are any obstacles along the way to stop the market moving in my direction, then I will simply trust this objectively and trade the market how I find it. At this moment in time there were no winning sellers until much higher about 99.00, which is an attractive profit target and exit for the trade. Of course there is no guarantee that the market will get there but if you’re working on solid risk to reward ratios during your trade setups, not every single trade has to reach its final target. I always say the winners will take care of themselves, as will the losers but only if you use a protective stop order. Let’s see how things panned out:
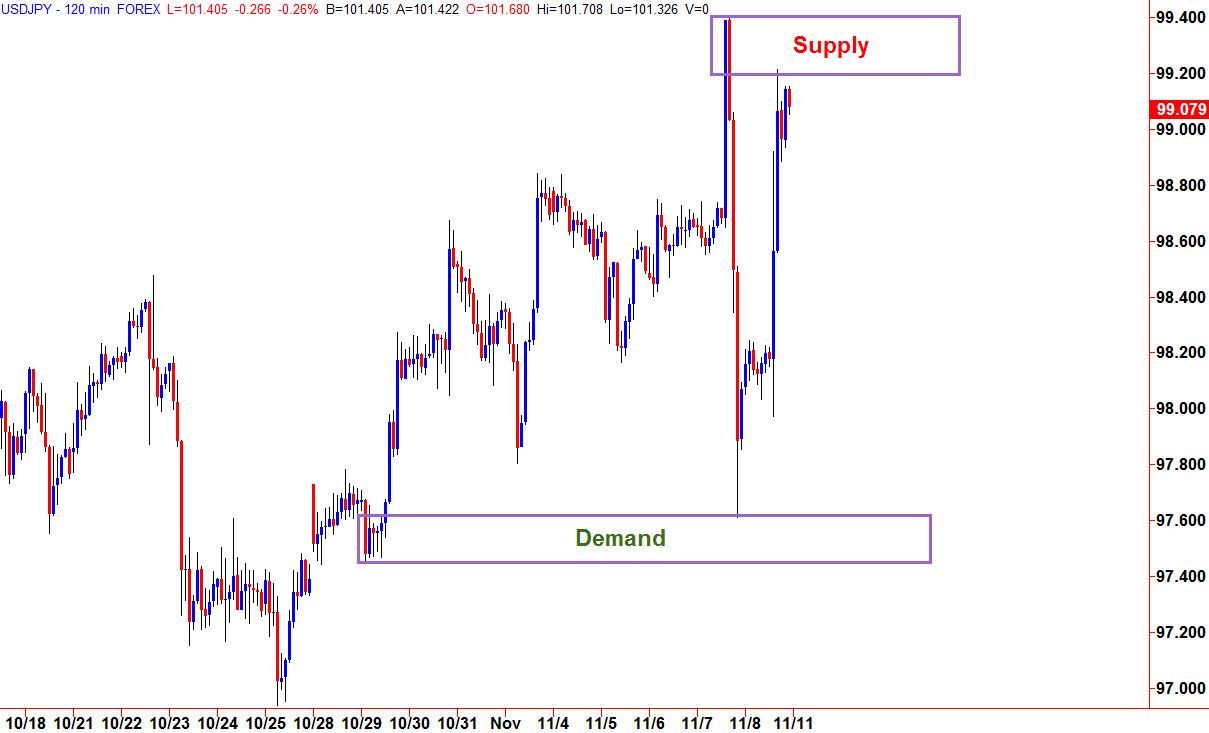
In this final chart snapshot, we can see that in as quickly as price fell towards our entry, it pretty much rallied all the way back up to where it came from in the same length of time. As I said before, our core strategy not only tells us when to get in and get out for a loss but it also tells us when to get out for profit but only if we learn to trust the levels which we are analyzing. The more that we learn to step away from the charts and allow the market to do its thing, without us actually being there to watch it, the more likely we are to have success at trading. I can put my own hand up and say that I’ve been the greatest enemy in my trading career over the years by fiddling and taking profits to soon, as opposed to trusting the levels which the market is showing me. Build your plan, do your analysis and let the market tell you what to do. That’s the key ingredient to consistency. I hope you found this useful.
Information on these pages contains forward-looking statements that involve risks and uncertainties. Markets and instruments profiled on this page are for informational purposes only and should not in any way come across as a recommendation to buy or sell in these assets. You should do your own thorough research before making any investment decisions. FXStreet does not in any way guarantee that this information is free from mistakes, errors, or material misstatements. It also does not guarantee that this information is of a timely nature. Investing in Open Markets involves a great deal of risk, including the loss of all or a portion of your investment, as well as emotional distress. All risks, losses and costs associated with investing, including total loss of principal, are your responsibility. The views and opinions expressed in this article are those of the authors and do not necessarily reflect the official policy or position of FXStreet nor its advertisers.