Defining the Line of the Trend
|With such a wide variety of trading tools and methodologies floating around the world today, is it any wonder that so many people find it highly confusing when deciding which to use? I certainly know that I pretty much tried and tested everything I could find since the start of my own trading career, and it is only years down the line that I come to a level of simplicity in my execution which helps me achieve what I need in the market. For me, less is more but that does not mean that I totally overlook and disregard everything else by any means. There are plenty of successful traders I know, who use completely different methods to me, like Fibonacci and Elliot Wave for example. However, they are also incredibly disciplined in their trading plans and follow them to the rule each and every time, unlike some other market speculators I have met who tend to jump aimlessly from one tool to the next, never really sticking with anything long enough to actually see if it works for them.
With this in mind, I thought that it would be helpful to explore some of the best ways to use the classic indicators and tools in conjunction with a solid core strategy. Everything has its own pros and cons and it is the trader’s job to make sure that they are fully aware of each and every one, in advance of using with their hard-earned capital at risk. For this week, I am going to take a look into one of the oldest and popular forms of technical analysis, namely the trendline. Of the numerous indicators and chart patterns I have personally studies and implemented over the duration of my trading career, the trendline was probably one of the very first I was introduced too. Simple in theory and truly diverse in its application and uses, the trendline should be one of the most useful tools a trader could bring to their arsenal, yet sadly, as with many conventional forms of technical analysis, the trendline too suffers from misuse by most. However all is not lost by any means and all it really takes is to step back and look at it in its most basic form and cut through the noise of over-analysis.
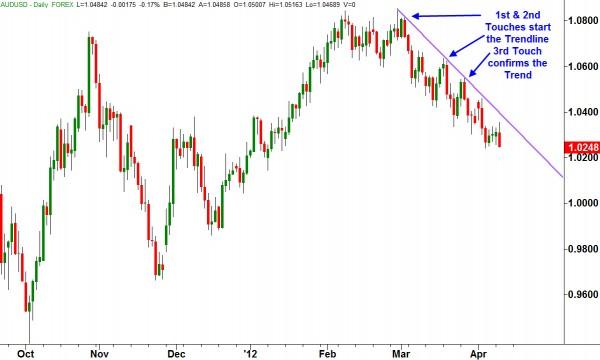
Firstly let’s explore the uses of a trendline. The original application is as a way of defining and confirming a trend which is currently in place. We draw the trendline line underneath the higher lows in an uptrend and on the flipside, we draw the line along the top of the lower highs in a downtrend. By doing this process, the trader now has a guide of the current price action and a projection for where trading entries and exits may be in the future, like below:
From the above example we can see a clear downside trend in place, with prices cleanly respecting the diagonal resistance provided by the trendline in place. When drawing the trendline, the rules are simple: the first and second touches are joined to create the potential trend, with the third touch being confirmation of the trend’s existence. The forward projection which trendline provides, also serves as a heads up for the trader of potential entries on pullbacks in the trend.
Another useful way to use the line is also a way of trailing a stop-loss order, so as to make the most of the trend as it develops over time. A simple and objective rule to implement in this instance, would be to exit a trade if the prices closed above the trendline in a downwards trend or closed below the trendline in an upwards trend. This closing would also be taken as a sign that the current trend is over and that we would expect a new one to begin or a change in direction looming.
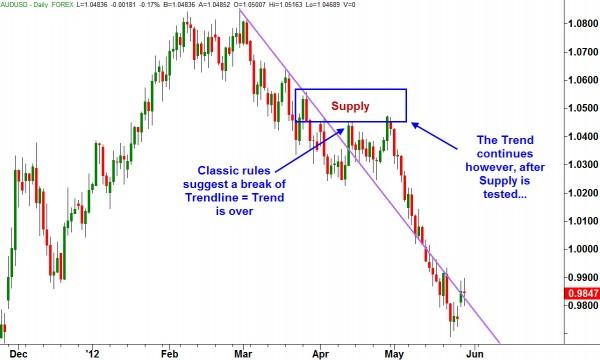
As I said, the trendline is useful tool if applied objectively, with three separate implementation of it highlighted above. However, as with all things positive, we also need to be fully aware of the negative side as well and the trendline like other technical tools is not without its flaws either unfortunately. Let’s take a look at how the above trend developed over the next period of time:
Frustration beckons! According to the rules, the trend in place was broken in the middle of April on the above chart, thus signaling a new potential change of direction to the upside, yet although the prices did go on to make a new higher low and higher high, we hit a major Supply level for the second time, resulting in a powerful continuation of the previous downwards trend after. This is a classic example of why we do need to be flexible in our thinking and expect the unexpected, even if it does not line up with our ideal plan. The market will always do what the market wants to do after all. The truly objective trader needs to remember that any trendline he or she may draw, is always going to be a late confirmation of the trend because if you have to wait for three touches of the trendline to confirm the trend, you then have to hope that you are not getting on board the ride too late.
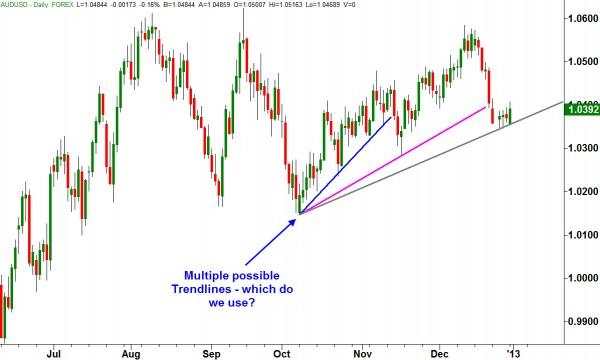
Another common challenge in trendline definition is the nature of their objectivity. You see a trend has to be very obvious when you are drawing your trendline because there is often more than just one way to draw the lines. One analyst may draw their line completely different to somebody else after all. Sometimes there may be more than one trendline in play at the same time too, as per the example below:
As we can see above there is a total of three trendlines in place on the market at this time, so which one do we honor? This is where the danger of subjectivity can easily creep in and if you find yourself in a similar analytical dilemma, you must have a rule-based methodology in your trade plan to deal with such scenario, keeping your trading decisions as objective as possible at all times. Personally, this is one of the reasons why I only draw trendlines in my charts which are so blatantly obvious that a child could see it! I certainly don’t want to find myself being the only person looking at a trendline which I think is in place but which nobody else can see.
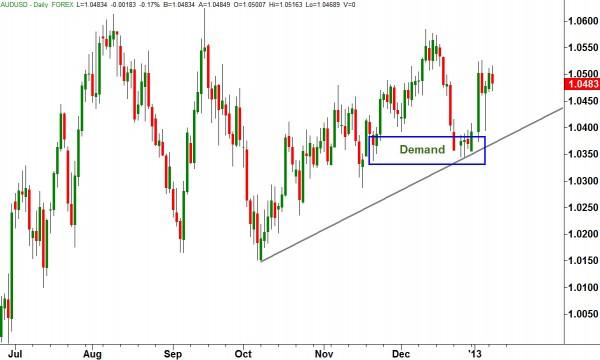
My simple resolution to this situation is to always go back to what I know best: Supply, Demand and Price. If I am struggling to draw a trendline to confirm my trend, then it is probably not really there in the first place, hence I look to what I do see regularly. A low risk, high potential reward Demand or Supply Zone always offers me the most objective trading setups in my humble opinion:
In the instance above, it is far easier to see the objective level of institutional demand at 1.0350, giving us a simple opportunity to buy this currency pair. If you were waiting for a trend to develop instead, you would have gotten your second touch of the line but you would have not taken a trade, with the market leaving you well behind. As I said at the start of this article, we always need to know how to use our trading tools in the most objective manner which allows us to remain unemotional and objective at all times. Trendlines are a great multi-functional tool without question but really come into their own when we look a little deeper into understanding the dynamics of Supply, Demand and Price in the first instance.
Wishing you a profitable trading week,
Information on these pages contains forward-looking statements that involve risks and uncertainties. Markets and instruments profiled on this page are for informational purposes only and should not in any way come across as a recommendation to buy or sell in these assets. You should do your own thorough research before making any investment decisions. FXStreet does not in any way guarantee that this information is free from mistakes, errors, or material misstatements. It also does not guarantee that this information is of a timely nature. Investing in Open Markets involves a great deal of risk, including the loss of all or a portion of your investment, as well as emotional distress. All risks, losses and costs associated with investing, including total loss of principal, are your responsibility. The views and opinions expressed in this article are those of the authors and do not necessarily reflect the official policy or position of FXStreet nor its advertisers.