Watching the Smart Money
|Futures’ trading has been around for hundreds of years. Even before Futures Exchanges existed trading was done by either a handshake or a forward contract. Producers and Processors of Commodities both have always needed a way to protect against price risk. The Producer, who owned the Commodity was concerned prices might drop before they delivered their product. Processors always worry that price might rise before they purchase the Commodity to process and later sell. Price risk is always a concern to these entities in the Futures markets.
These entities are comprised of Commercial traders who use a physical Commodity in their day to day business. Commercial traders do approximately 60% of the daily volume in the Futures markets. This makes Commercial traders the largest participant in the Futures markets, next is the Large Speculator and then the Small Speculator.
Commercials know everything there is to know about the Commodity they produce or process. They specialize in that particular market making them the expert on the Fundamentals. If anybody knows the Seasonal patterns of a Commodity it would be the Commercials who deal with this Commodity every day. They’re very well capitalized companies, both in cash and credit lines at major banks. The Exchanges put no restrictions on the number of contracts they can trade. Just these 3 components make the Commercial trader the smart money in the Futures markets and speculators usually lose when they bet against them.
The other significant player in the Futures markets is the large speculator. These are usually companies or individuals that manage funds for other investors. Some examples might be: Commodity Trading Advisor (CTA), Commodity Pool Operator (CPO), Hedge Funds, and Pension Funds and in some cases large individual traders. Like all speculators they are in the business to speculate and make money by correctly determining the markets next direction.
With so much money to invest they are generally going to be using trend following methods to make their buy and sell decisions. Like all speculators they are only given so much money to invest for others and it is possible they run out of buying power before a trend actually ends.
Also, the Futures Exchanges have restrictions on the number of contracts they can actually trade at any one time. Most large speculators know little about the fundamentals of the markets they trade because they are so diversified in other markets. These 3 components are actually a handicap when they enter the market and begin betting against Commercial traders.
But how do we as small speculators track the positions of these large participants?
A report that is released weekly at 15:30 Eastern Time by the Commodity Futures Trading Commission (CFTC) called the Commitment of Traders (COT) report is the answer. If you are using Trade Station you can see the results on your daily charts. Contact Trade Station and ask them how to insert the indicator called “COT Net Position”.
The COT report tracks the Open Interest, number of contracts yet to be offset and breaks the Open Interest down into Commercial and Speculator positions. Each week we can see how many long and short positions are held by each group of traders. We then subtract the long positions from the short positions and we get a net position for each group. The net long or short is what we will follow in the COT report each week.
By using our charting packages and other websites we can see when the speculators are betting against the commercial traders at extremes. Chart 1 will show us many important pieces of information about the COT report.
First let’s understand that the COT report is a tool to help identify when a trend may be ending and in some cases when another is about to start. The COT is not a timing tool and should not be used as such. Look to use the COT when prices have been trending for an extended period of time and price is coming into a supply/demand zone on a daily, weekly or monthly chart. Think of the COT report as an odds enhancer.
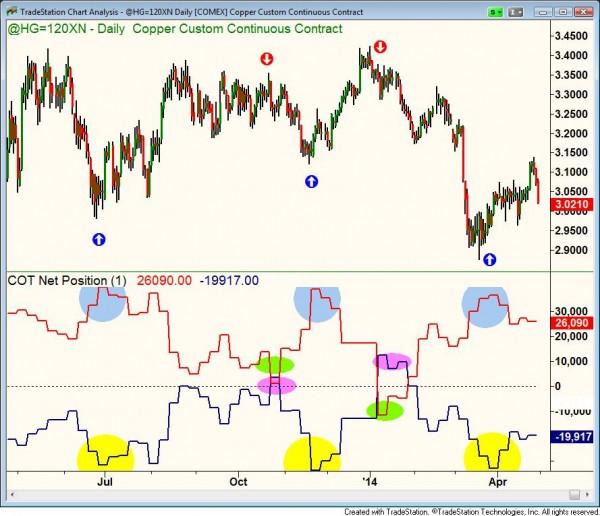
Let’s review Chart 1 and discuss some of the important points about it.
The chart is of the Copper market. You can set your chart to daily, weekly or monthly to view a COT report, but intra-day charts will not work. The next thing you need to do is configure your screen to only see 12 months of data. My chart above is from May 2014 back to May of 2013. This is referred to as a 52 week look back period.
Next we need to identify what the lines mean. The red line represents the Commercial traders. The blue line represents the large speculators. Each week the COT report is released the chart will plot the net difference between the Commercials and Large Speculators positions. As of last week the red box on the right shows the Commercials had 26,090 more long positions than short positions. The blue box shows the large speculators had -19, 917 more short positions than long positions. Note: The CFTC also list the small speculator each week in the COT report, but they have no impact to speak of on market prices anymore so we just focus on the Commercials and larges speculators.
Just knowing the net positions by themselves does not tell us a lot about the positions held by these large participants. But using the 52 week look back period we can look and see if the current weeks COT report is at an extreme of the last 52 weeks of the report.
Starting from the right and working left we can see some of these extremes that happened in the past and how price reacted to these extremes. In April you see that the blue line is near the lowest point (yellow ellipse) than at any other time during the last 52 weeks. This means that the large speculators have been following the price down by selling in the downtrend to their most bearish position in the past 52 weeks. At the same time the red line, Commercial traders were at the highest level (blue ellipse) than at any time in the past 52 weeks. This means the Commercials have been buying into this price decline and absorbed all of the supply the large speculators had. Now look up at the chart and notice the blue arrow under the price low, the Commercials then caused the price to rally.
This same pattern can be seen by looking back and seeing what the price did when the large speculators had too many short positions (yellow ellipse) and the Commercials were buying from the large speculators and absorbing the supply (blue ellipse). Each time the two participants were at or near their 52 week extremes price changed direction. Speculators can bet against the Commercials and win for a while, but soon the Commercials step up to defend prices and take advantage of the price extremes.
Commercial buying was probably by processors of the industrial metal, locking in low prices for future delivery. Next we will look at what happens when the producers get aggressive and start selling into price rallies.
Around February 2014 we see the Commercials (green ellipse) holding the least amount of longs than at any other time in the past 52 weeks. They had a net short position. The large speculators (purple ellipse) held the largest net long position than any other time in the past 52 weeks at the same time. Again, betting against Commercial traders when they are at extremes is not a wise choice. The price chart shows a red arrow at the top of the chart. We see price fell from those highs due to Commercial selling.
In November 2013 we see the same pattern where the Commercials were selling and the large speculators were buying. Because the Commercials had more shorts than longs and at a 52 week extreme the price again fell.
Each week you will review the COT and your objective will be to find markets that the net positions are currently making new 52 week highs or lows. Then you know you have found a market that is poised to reverse a trend if one existed or possibly begin a new trend. Keep in mind, this is not a timing tool and it must be used in conjunction with our technical analysis to determine if there is a good trade or not.
If you learn to read the COT report you can find some interesting opportunities in the Futures markets. Don’t forget that you can learn to read the COT report and trade Exchange Traded Funds (ETF’s) on Commodities instead of the Futures contract.
“There are no mistakes in life, just lessons”
Information on these pages contains forward-looking statements that involve risks and uncertainties. Markets and instruments profiled on this page are for informational purposes only and should not in any way come across as a recommendation to buy or sell in these assets. You should do your own thorough research before making any investment decisions. FXStreet does not in any way guarantee that this information is free from mistakes, errors, or material misstatements. It also does not guarantee that this information is of a timely nature. Investing in Open Markets involves a great deal of risk, including the loss of all or a portion of your investment, as well as emotional distress. All risks, losses and costs associated with investing, including total loss of principal, are your responsibility. The views and opinions expressed in this article are those of the authors and do not necessarily reflect the official policy or position of FXStreet nor its advertisers.