Can You See the Timeframe for the Forest?
|If you are a one timeframe trader, you are standing in front of a tree having no idea what Forest you are in. There are so many things you won’t understand about that tree, where you are at, and what to expect. In trading, one timeframe traders simply can’t compete with those who view and quantify the markets entire supply and demand picture.
Often I hear traders talk about the timeframes they look at when they trade. I hear many different things like “I trade off of a 2 minute chart”, “the daily”, “I like the 466 tick chart”, and so on. When I ask them what other time frames they look at, I can pretty much tell if they are profitable or not and here is how. For those who trade using JUST one time frame, I have yet to see anyone make consistent profits doing that. For those who trade using the smaller time frames and also look at the larger time frames, that is a recipe for profits assuming you do it right.
You may have the best buy setup you have ever seen on a 5 minute chart but if that is anywhere close to supply, that you would only see on a larger time frame, and that buy setup is not likely to work. Conversely, you may have the “picture” of what appears to be a very high probability sell setup on the 30 minute chart but if that is anywhere near demand, that you would only see on a larger time frame, and that trade is not likely to work.
There is another reason to focus on more than just a one time frame or two, trends. Trends begin and end at fresh demand and supply levels. I look at weekly and daily charts each week to identify larger time frame demand and supply level for three reasons:
-
To know where existing trends are likely to end and new ones begin
1.We want to be first in line, at the right time, when the risk/reward is ideal
-
To know what side of the market carries the greatest odds
-
To identify and enter positions, before everyone else does
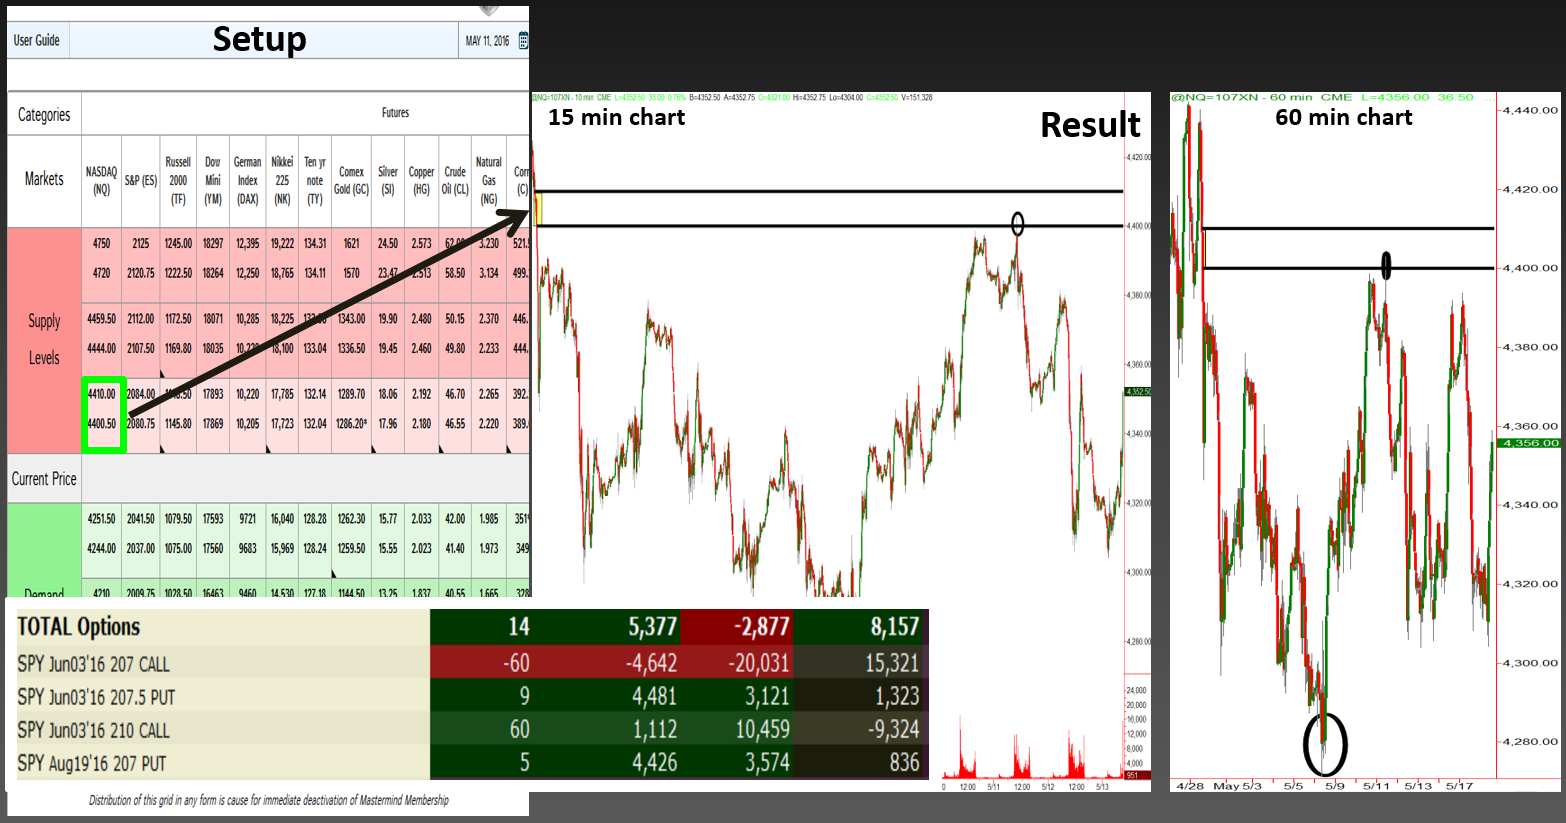
Point number three above has four key words in it that you must understand: before everyone else does. Let’s take a look at a trading opportunity recently identified in the Mastermind Community that used the combination of a large time frame opportunity and small time frame analysis to limit risk and maximize reward. May 11th on the Mastermind Community supply / demand grid, we identified a supply level (bearish opportunity) for our students in the NASDAQ Futures at the 4400.50 – 4410.50 level.
The Opportunity
Let’s look at the daily 60 Min chart of the NASDAQ on the right. The black horizontal lines represent the supply level in the NASDAQ, meaning banks were selling that market in a big way at that level. Next, look at the circle at the bottom of that chart. The fact that price went that low prior to the bearish opportunity means significant demand can’t be above that level. With that information, we know that supply or retail prices are just above and demand or wholesale prices are far below, meaning a decline is coming. Around the time of the move in price back into that level, which is where I put on a bearish position, I heard in newsletters, on TV, in trading rooms and more that the NASDAQ was likely to breakout above those highs, setting the stage for a big rally. The more it became clear to me that everyone was focused on buying, and knowing what a big mistake that was according to the chart, the more I focused on finding a low risk, high reward and high probability entry to make sure we (OTA traders) could sell into this market, well before everyone else did. A bearish position, like the one below, that I took with options at our supply level combined with the precise entry found on the 15 minute chart offered a very low risk entry to bet on the downside and a key opportunity to enter into the market well before the group of retail traders and investors.
Supply/Demand Grid Passive Income Trade: May 11, 2016
The key to making this happen was properly combining larger time and smaller time frame supply and demand analysis to accomplish these two important goals, entering a bearish position before everyone else did and doing it with a very low risk entry. Furthermore, notice the trade was taken using SPY options. Along with using multiple times frames to gain a significant edge in the markets, I also utilize multiple asset classes. With this opportunity, I liked the prices I was getting in the SPY more than the QQQ. For this trade, I combined Futures, ETF’s and Options, along with multiple time frames. While this may seem complicated, it actually makes things much easier. What is very hard to do is accomplish consistent results using one time frame and one market. Make sure you know what forest you’re in, it will make your experience with the trees much better…
Hope this was helpful, have a good day…
Information on these pages contains forward-looking statements that involve risks and uncertainties. Markets and instruments profiled on this page are for informational purposes only and should not in any way come across as a recommendation to buy or sell in these assets. You should do your own thorough research before making any investment decisions. FXStreet does not in any way guarantee that this information is free from mistakes, errors, or material misstatements. It also does not guarantee that this information is of a timely nature. Investing in Open Markets involves a great deal of risk, including the loss of all or a portion of your investment, as well as emotional distress. All risks, losses and costs associated with investing, including total loss of principal, are your responsibility. The views and opinions expressed in this article are those of the authors and do not necessarily reflect the official policy or position of FXStreet nor its advertisers.