You Have the Map, Do You Know How to Read It?
|
I remember when I was a kid, people still used paper maps. Remember the folded paper map in everyone’s glove compartment? Having to look at it at every stop light? Yes, for those of you under 30 years old, there was such a thing as paper maps and yes, it’s much easier today. As a kid sitting in the back seat, still a few years away from hand held gaming and smart phones, I was a little bored at the time. With the maps, I used to imagine what they would look like if the streets weren’t labeled. Now look at the stock chart below, not all that different.
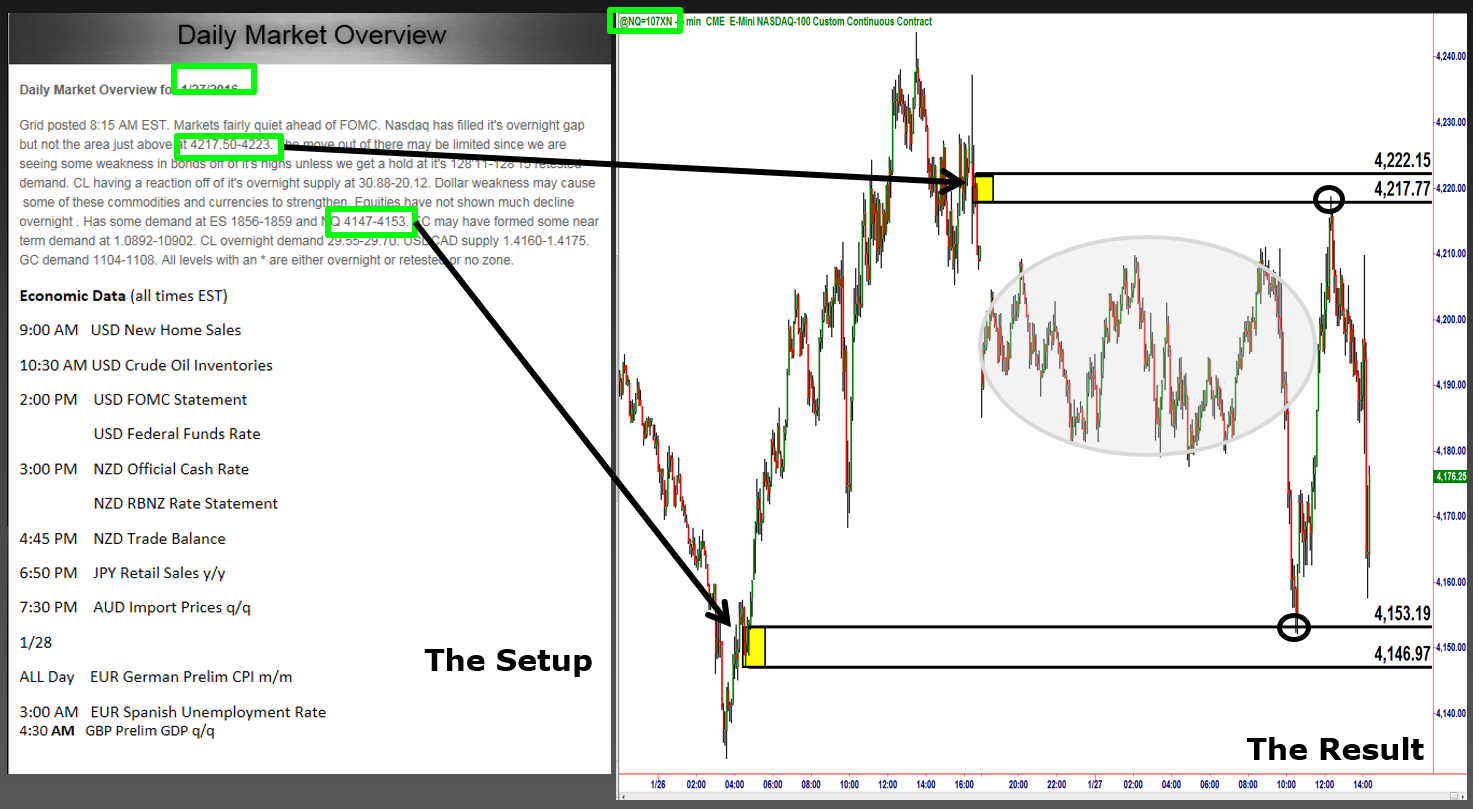
This is a chart from our Daily Market Overview service that goes out to our members each day, showing the NASDAQ moving from demand to supply and back again. To make chart reading easy in my articles, I label them so that you can learn from them, but well before any labels are on the chart and long before the trades are taken, it’s a blank chart/map with no street signs helping you decide what to do.
1/27/16 – Daily Market Overview
The yellow shaded boxes are the supply and demand levels we found for our members, demand on bottom and supply on top. Without the labels on the stock chart, would you be able to identify those turning points? Let me walk you through so you not only have the map, but also understand how to read charts without labels. In each yellow shaded area price moved away from that level in strong fashion. Price also spent very little time at those levels. These two factors, along with the specific pattern itself, tell us there is a major supply and demand imbalance at those levels. Meaning banks (smart money) are buying and selling at those levels. What about the shaded grey area in the middle? Many will look at that area and think that because of all the trading activity there must be strong supply and demand. Actually, the opposite is true… The fact that so much trading activity took place and in such a big range tells us there can’t be a significant supply and demand imbalance in that area. If there was, price would spend a very short period of time at the level and move away in strong fashion. The price action in the grey area actually tells us that the buy and sell orders in that area are filled, meaning price should move quickly through that area in the future, like it does. So, the opportunity was that we had a strong fresh supply and demand level with a very large profit zone between them (thanks to the price action in the grey area).
It all comes down to understanding that the movement in price in any and all markets is always a function of pure supply and demand. The key is to know what this looks like on a price chart and executing your rule based strategy without thinking and emotion. Another way to say this is to know how to spot key pockets of “unfilled orders” (yellow boxes) on a stock chart. When you can do this, that means you can also spot the profit zones where the orders are “filled” (grey area). Price charts are just another map, evolving from paper to the screens just like the old paper road map and today’s GPS. If you don’t know how to read the map, be careful putting your money at risk because there are very good map readers that will be happy to take your hard earned money.
Hope this was helpful, have a great day.
Information on these pages contains forward-looking statements that involve risks and uncertainties. Markets and instruments profiled on this page are for informational purposes only and should not in any way come across as a recommendation to buy or sell in these assets. You should do your own thorough research before making any investment decisions. FXStreet does not in any way guarantee that this information is free from mistakes, errors, or material misstatements. It also does not guarantee that this information is of a timely nature. Investing in Open Markets involves a great deal of risk, including the loss of all or a portion of your investment, as well as emotional distress. All risks, losses and costs associated with investing, including total loss of principal, are your responsibility. The views and opinions expressed in this article are those of the authors and do not necessarily reflect the official policy or position of FXStreet nor its advertisers.