Market Timing Made Simple
|When it comes to market timing (why market prices turn and how to predict that), there are many opinions out there. There are the many different fundamental factors such as global economic reports, the health of corporate profits and so much more. The thought is when the data is good, market prices rise and when the data is weak, market prices decline. If this market timing theory worked and it was this easy, everyone would make fortunes trading and investing.
Then there is a school of thought called “technical analysis”. As I have written about before, this school of thought focuses on price patterns on a chart that, in theory, help you predict market turning points and market moves in advance. There are many flaws with this form of analysis but one of the biggest is that you’re almost always buying after price rises and selling after price declines, which is not how you profit buying and selling anything.
In this piece, I want to offer a very simple and real alternative to how you “think” the markets. Instead of thinking conventional technical and fundamental analysis, let’s focus on one thing and one thing only to do our market timing analysis, Buy and Sell orders. To do this, let’s use an example from a recent buying opportunity in the S&P from our OTA Supply/Demand grid, a service we publish daily for our members.
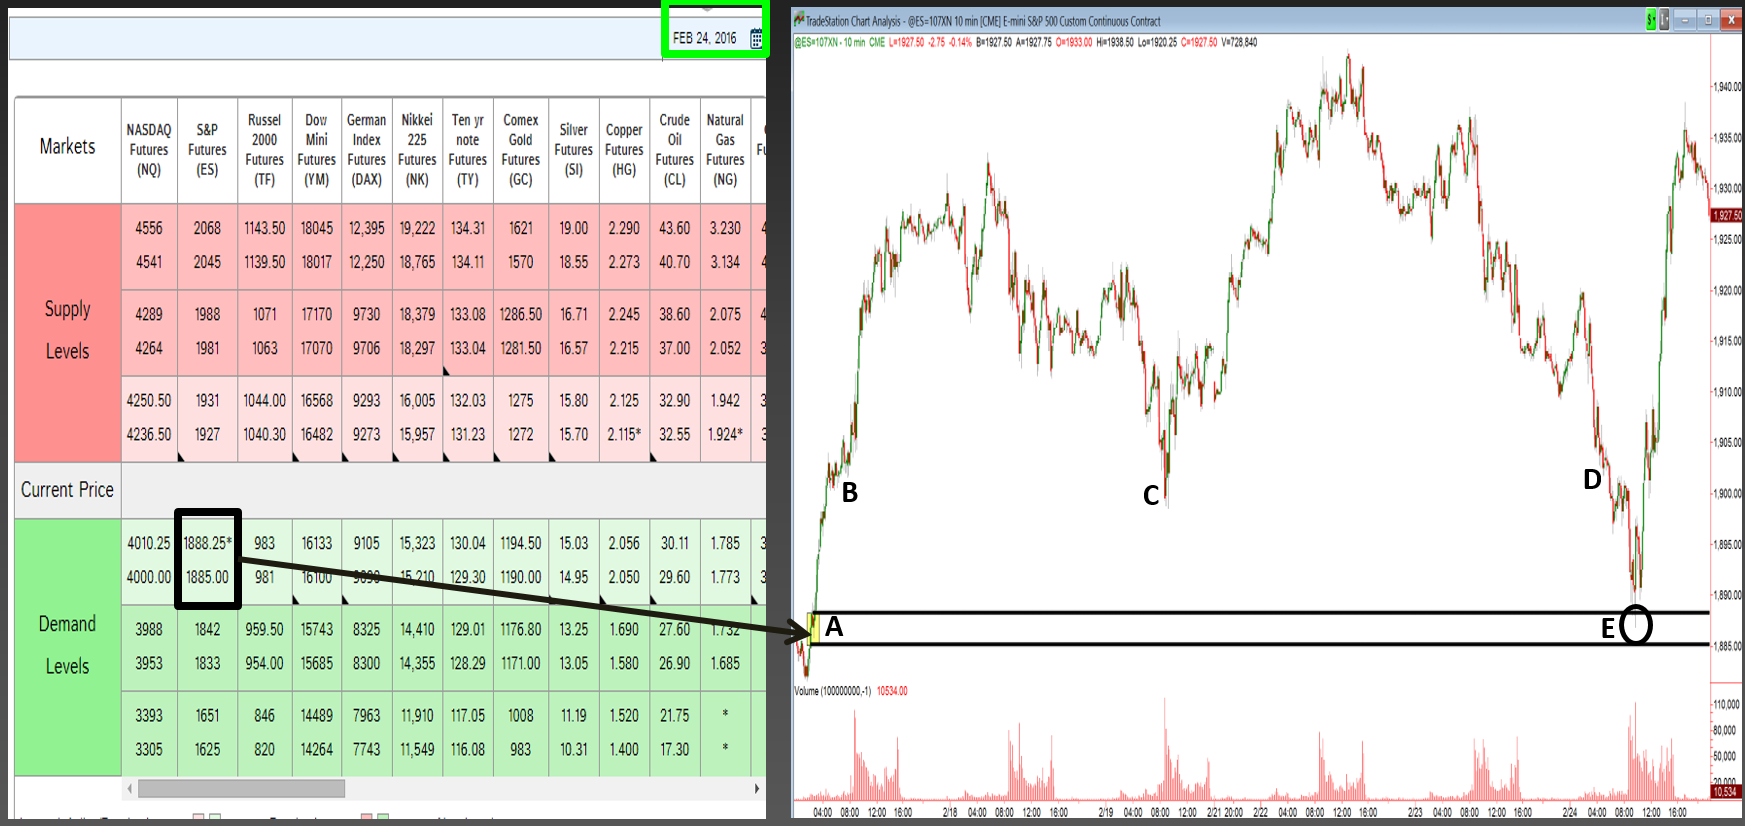
OTA Supply/Demand Grid Feb. 24, 2016 – S&P Buy Setup
A – “A” represents a Demand zone where banks and financial institutions are buying. This demand zone was on the grid because it achieved a very high odds enhancer score. There was very little trading at the level followed by a strong rally from the level. This told us demand greatly exceeded supply. Once the last sell order is filled and you have buyers at the price who still want to buy, price will rise; this is a supply/demand imbalance and the result of it.
B – “B” also represents a demand zone for the same reasons as “A”.
C – “C” is the decline in price to demand level “B”. This is when our rules tell us to buy. At “C”, sellers are making two key mistakes. They are selling after a decline in price and at a level where the chart already told us demand exceeds supply. In short, novice traders and investors are selling at a price level where banks are buying.
D – “D” is the second time price revisits demand zone “B”, however, this time price falls right through it. This is expected as the demand is not there anymore due to the trading at “C”. In other words, the buy orders are filled already which is why we expect price to keep declining at “D”.
E – “E” is the first time price declines to our grid demand zone “A”. This is when our members are taught to buy. Again, banks (smart money) are buying and the ill-informed are selling. The reason price rallies so strong and far from our demand zone “A” is because there is no supply above to stop it. This large profit zone is another reason that level made it onto the grid.
The movement of price in any and all markets is a function of an ongoing supply and demand equation. Prices turn at levels where this simple and straight forward equation is out of balance. It’s not about the filled buy and sell orders that create the candles and bars you see on your price charts. The supply and demand imbalance that causes price to turn is because of the unfilled orders that are not represented by the data you see on charts.
Hope this was helpful, have a great day.
Information on these pages contains forward-looking statements that involve risks and uncertainties. Markets and instruments profiled on this page are for informational purposes only and should not in any way come across as a recommendation to buy or sell in these assets. You should do your own thorough research before making any investment decisions. FXStreet does not in any way guarantee that this information is free from mistakes, errors, or material misstatements. It also does not guarantee that this information is of a timely nature. Investing in Open Markets involves a great deal of risk, including the loss of all or a portion of your investment, as well as emotional distress. All risks, losses and costs associated with investing, including total loss of principal, are your responsibility. The views and opinions expressed in this article are those of the authors and do not necessarily reflect the official policy or position of FXStreet nor its advertisers.