The Art of Trading?
|
How many times have you heard someone say, “Trading is an art, not a science.”? I have heard that for years and years and I have to say, it is probably the most ridiculous statement I have heard when it comes to trading and, as we all know, there are some pretty ridiculous statements in the trading world. There is absolutely nothing artistic about trading at all. This is, 100%, a numbers game… How much willing demand and supply there is at each price level is what determines price turns and movement. It’s the buy orders vs. the sell orders and, again, it all comes down to the numbers on both sides of that equation and nothing else. To think Picasso or Van Gough should be brought into this discussion is rather amusing if you think about it. To illustrate the point, let me share a very recent trade we setup for our students in the Extended Learning Track (XLT, our live Forex trading room).
Live Trading Session – Feb. 12, 2016
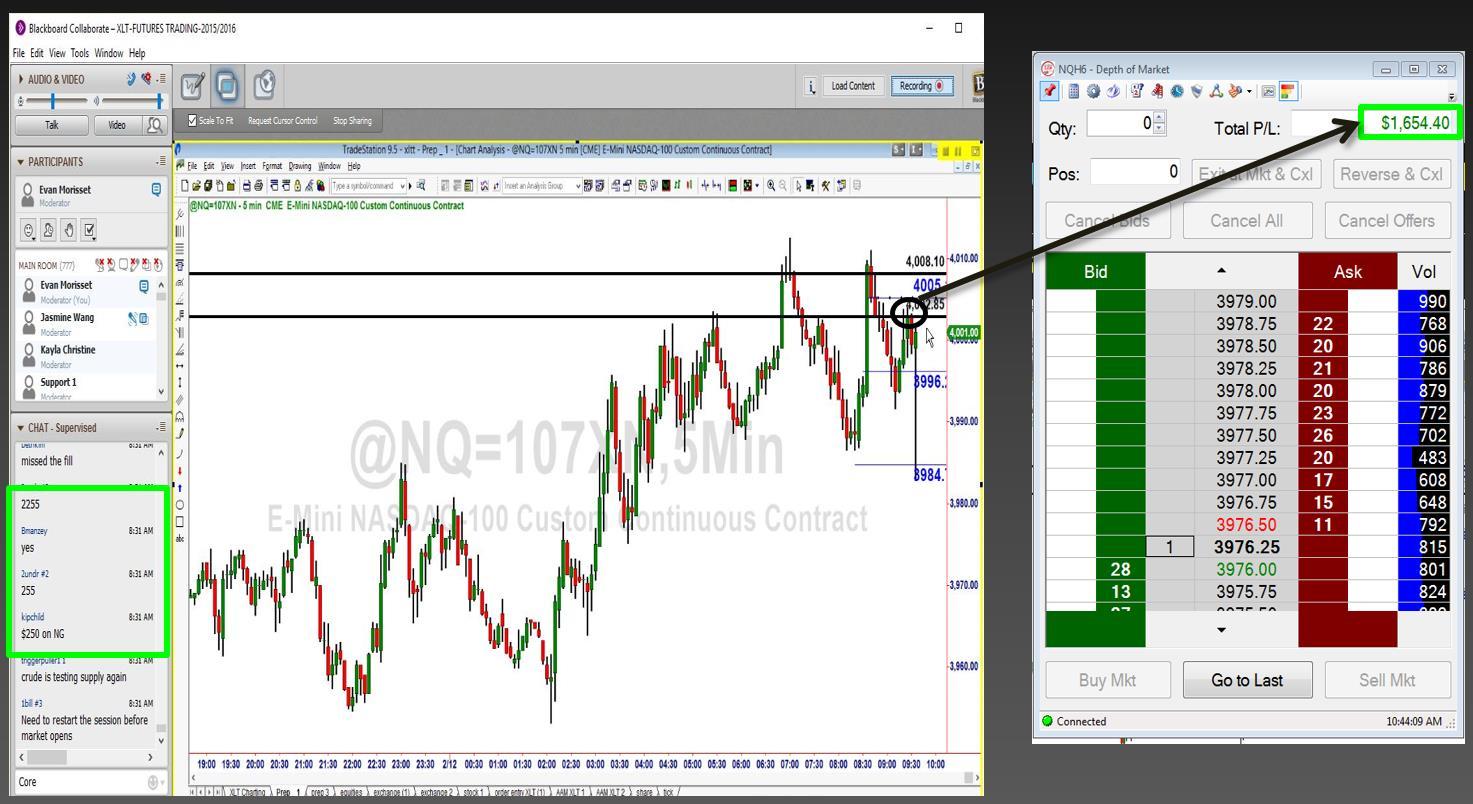
During this session we were going over a shorting opportunity in the NASDAQ. Notice the supply level with the black lines around it. According to our supply and demand strategy that I write about so often, that area shaded was a key supply level. Meaning, institutions/banks had large orders to sell at that level, there was a significant supply and demand imbalance at that level. We know this because price could not remain at that level and declined in strong fashion after a very short period of time (Odds Enhancer #1). Think about it, if supply and demand were in balance at that level, price would have remained at that level, but it couldn’t because supply and demand were very much “out of balance”. I mentioned price spent very little time at that level and this is a key point. OTA Odds Enhancer #2: The less time price spends at a level, the more out of balance supply and demand is at the level. Trading books tell us when looking for key support and resistance levels to look for areas on the chart where there was lots of trading activity, many candles on the screen, above average volume and so on… If you think the simple logic through, I think you will find the opposite to be true. At price levels in any market where supply and demand are most out of balance you are going to get very few transactions (trades), not many trades. Therefore, that picture on a chart is going to be few candles on the screen, not many like all the trading books say and this was the case in our trading opportunity above.
As you can see on the chart to the right, a bit later price rallied up to the supply level offering us an opportunity to sell short with a significant profit zone below. As the chart shows, there was little demand below meaning price should have a very easy time falling. Lastly, when price reaches supply we always want to know who we are selling to. We need to make sure we are selling to a novice retail trader, someone who is clearly willing to pay retail prices. The way we answer this questions is this: Is the buyer we are selling to buying after a rally in price and into a price level where supply exceeds demand. These are the two footprints of a novice market speculator. If the answers are yes and the risk to reward meets the minimum criteria we are looking for, we take the trade like a robot.
The mathematical equation we mapped out in advance played out as we thought and our profit target was achieved. If you think art had anything to do with this, I have an original very rare one of a kind painting that was painted by Big Foot in the Rocky Mountains 200 years ago. It’s worth $100,000 but I will give it to you for $10,000, so hurry. You see, when I was on the institution side of the trading business it was very clear from day one that price moves 100% because of an ongoing supply and demand equation in each and every market. Trading opportunities exist when this simple and straight forward equation is out of balance. At the CME where I began my career, they didn’t have Monets or Picassos on the wall, they had bids and offers. If I wanted to see art, I would walk down Monroe Street to Michigan Avenue and go to the Art Institute. Goldman Sachs doesn’t start out each trading day with a company meeting to discuss artistic opportunities in the market; every single decision is based on inventory, order flow and risk/reward. The only place art and trading come together is in the world of conventional technical analysis. Meaning, conventional chart patterns which people refer to as the “art,” like Head and Shoulders, Cup and Handle and all the others that will serve you much better with a frame around them on your wall than they will trying to use them to make money. While I may get some unfriendly emails from this article, I take it as my responsibility to be very honest with people as your hard earned money is on the line with each and every trade.
Hope this was helpful, have a great day.
Information on these pages contains forward-looking statements that involve risks and uncertainties. Markets and instruments profiled on this page are for informational purposes only and should not in any way come across as a recommendation to buy or sell in these assets. You should do your own thorough research before making any investment decisions. FXStreet does not in any way guarantee that this information is free from mistakes, errors, or material misstatements. It also does not guarantee that this information is of a timely nature. Investing in Open Markets involves a great deal of risk, including the loss of all or a portion of your investment, as well as emotional distress. All risks, losses and costs associated with investing, including total loss of principal, are your responsibility. The views and opinions expressed in this article are those of the authors and do not necessarily reflect the official policy or position of FXStreet nor its advertisers.