The Age of Supply and Demand
|When using supply and demand to identify turning points in a market, a question that comes up often is, “How far back should I look for a supply and demand level?” The proper answer is this: Look back as far as you need to in order to find “fresh” demand and supply. The key word is fresh as those represent the highest probability turning points. At those points, you have the highest amount of unfilled buy and sell orders. The definition of fresh is beyond the scope of this piece but that’s ok.
Since the OTA Supply/Demand Grid began March 1, 2012, our Supply and Demand service has identified the turning points in some of the major markets much of the time. We produce these levels and release them each weekday very early in the morning. The reason for the consistency is that we are focused only on bank and financial institution demand and supply, nothing else. In other words, the levels that you see on the grid below are “fresh” demand and supply. Having this information as an income trader or longer term investor is key.
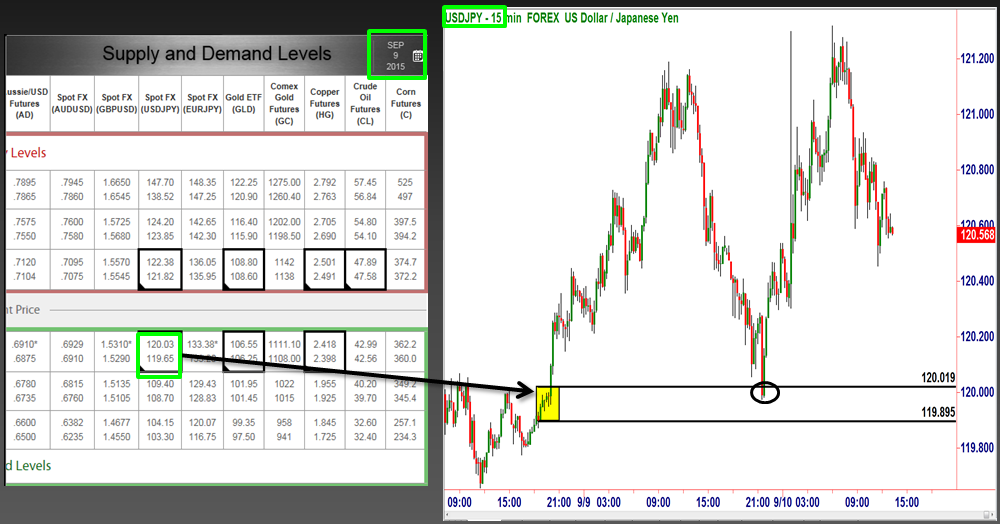
Supply Demand Grid 9/10/15 – USDJPY
Notice the demand level above. To the left of it, price struggled moving higher and declined from that area a couple times. Then, price finally moved past that level leaving a fresh demand zone (yellow shaded area). In other words, the supply demand equation at that level flipped. The very next day, price declined back to that level (circled area) and rallied, offering OTA grid members a low risk, high reward and high probability buying opportunity. The question many students had was: “How was that level found given that the last time price had been there was over a day ago?” While I don’t have room to explain it in full here, we can explore some points of interest in hopes that the information will help take your trading to the next level.
Sometimes, when price is far out on the curve, we look back months and years to find fresh levels. When we looked back, we looked for the picture on the chart that represented fresh demand, and there it was. It also had all our “Odds Enhancers” associated with it which made it a key level. I am not suggesting that all the same buyers who bought at that level 2 days earlier are still sitting there with buy orders, though some likely are, that’s not the case. What the chart does however is show us the aggregate supply and demand equation at each price point in a market.
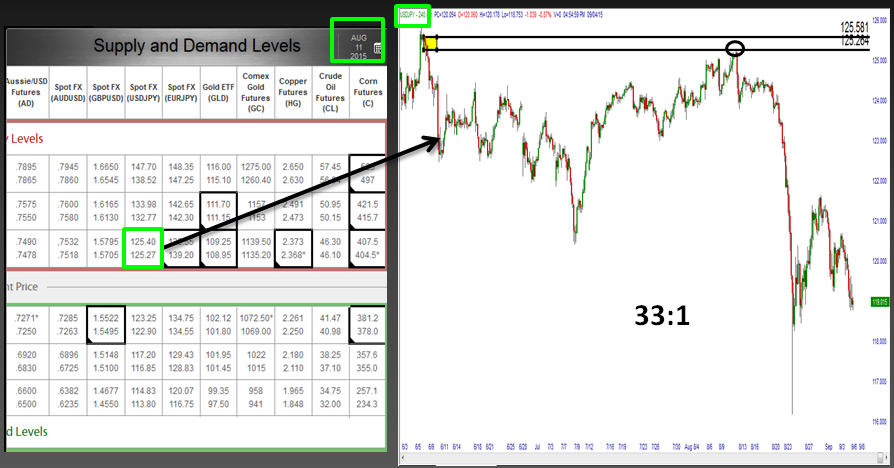
Supply Demand Grid 8/11/15 – USDJPY
In this next example we had to look back almost 2 months to identify the fresh supply level that met our Odd Enhancer criteria. As you can see on the chart, price rallied up to that level (circled area) and collapsed as it should. This offered our students/traders a low risk, very high reward and extremely high probability shorting opportunity. This one created a few more email questions from students asking: “Are supply and demand levels from a long time ago any good?” The answer is yes, yes, yes… In fact, these are some of my favorites. The reason is this… Think about it, the fact that price is revisiting a supply or demand level from so long ago means by definition, “price” is way out on the supply and demand curve, extremely high or low. This means levels in these areas are going to carry strong odds of working and have huge profit zones. I find it so interesting that most people are not comfortable entering positions in markets at extremes and instead want to trade in the middle. All the best odds and biggest profit zones are out at the extremes.
The point of this piece is not to impress you, but more importantly to impress upon you two very important things:
1) The key to knowing where market prices are going to turn in advance and also where prices are going to go with a very high degree of accuracy means knowing exactly what institution/bank demand and supply looks like on a price chart in any market and any time frame. This is our focus in the XLT and Mastermind Community where the Supply/Demand grid is found.
2) Understand that supply and demand levels created long ago can serve to be very strong levels. The fact that they were created long ago is not a bad thing, it’s actually a positive for those reasons.
Hope this was helpful, have a great day.
Information on these pages contains forward-looking statements that involve risks and uncertainties. Markets and instruments profiled on this page are for informational purposes only and should not in any way come across as a recommendation to buy or sell in these assets. You should do your own thorough research before making any investment decisions. FXStreet does not in any way guarantee that this information is free from mistakes, errors, or material misstatements. It also does not guarantee that this information is of a timely nature. Investing in Open Markets involves a great deal of risk, including the loss of all or a portion of your investment, as well as emotional distress. All risks, losses and costs associated with investing, including total loss of principal, are your responsibility. The views and opinions expressed in this article are those of the authors and do not necessarily reflect the official policy or position of FXStreet nor its advertisers.