Governing Dynamics of Price Action
|I have been involved with trading and investing for more than twenty years. Low-risk profits are a function of trading what is real, not what I feel. I’m able to eliminate subjective emotions from my trading by basing each and every decision on a simple mechanical set of objective rules that quantify supply and demand. These simple rules stem from three principles of price movement I crafted for my own trading long ago. These three principles form the foundation upon which my trading and investing is based. While everyone’s trading strategy will always be a bit different, perhaps today’s article will help set you on a path that allows you to focus on what is real and not what you feel…
Principle 1: “Price action in any free market is a function of an ongoing supply and demand relationship within that market”.
Principle 2: “Any and all influences on price are reflected in price.”
Principle 3: “The origin of motion/change in price is an equation where one of two competing forces (demand and supply) becomes zero at a specific price.”
First, understand that there are always two competing forces at work in the market, buyers (demand) and sellers (supply). Our goal is to quantify those forces and identify price levels where the imbalance is greatest as this creates change, or movement in price.
Let me tell you a quick story… Years ago, I was speaking at a University in California. My lecture showed how to quantify supply and demand in the markets. While on a break, a gentleman mentioned to me that he had been actively educating himself on proper investing for years and still felt he had more to learn as nothing he had come across made much sense. He mentioned that he was really enjoying my material and asked me a couple questions. I asked him to briefly explain his background as that would best help me assist him with his question and help move him toward his goal. One of the first things he mentioned was that he had studied earthquakes in his past, it was what he did for a career many years ago.
I stopped him right there. I asked him if he knew exactly what causes an earthquake. He replied “yes, of course,” as if I was asking him if he knew how to tie his shoes. I then told him that I was about to give him the most valuable trading information he had ever received. I explained that with his earthquake knowledge, he had all the foundation knowledge he needed to trade or invest properly and achieve consistent low risk returns in any market. I explained that there is absolutely no difference in how one quantifies a potential earthquake to how someone quantifies a potential trading/investing opportunity. In an earthquake, two competing forces (in this case two giant plates of earth) press against each other until a threshold is met that creates change/movement (the earthquake). When one mass of earth overwhelms its competitor (the opposing plate of earth) the earth moves and we have an earthquake. The two competing forces in trading/investing are buyers and sellers. How we quantify these two forces is no different from how we quantify the two competing forces that lead to an earthquake, or any other example where two opposing forces come into play.
Principle 1: Price movement in any free market is a function of an ongoing supply and demand relationship within that market.
Put quite simply, a trading and investing market is made up of three components: buyers, sellers and a widget being bought or sold. These widgets may be shares of a stock, S&P futures, foreign currencies, bonds and many more tangible and intangible “widgets.” For example, let’s say the widget is a stock. This stock has some value. That value or “price” as we call it is determined simply by the supply and demand for the stock which is the ongoing interaction of all the buyers and sellers taking action with regard to that particular stock.
A market is always in one of three states of price action:
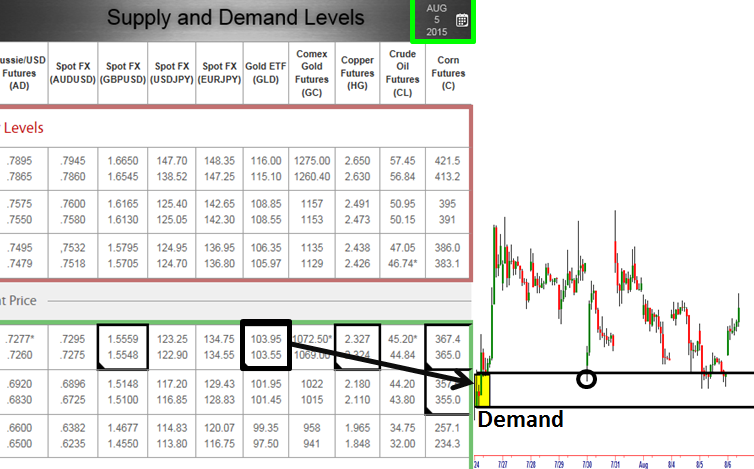
First, it can be in a state where demand exceeds supply which means there is competition to buy and that leads to higher prices. What does this look like on a price chart? Below is one of the many demand levels I have shown on charts over the years.
Supply/Demand Grid Aug 5, 2015 – Demand:
Second, it can be in a state where supply exceeds demand which means there is competition to sell and this leads to declining prices. What does this look like on a price chart? Below is one of the many Rally – Base – Drop supply levels I have shown over the years.
Supply/Demand Grid Aug 5, 2015 – Supply:
Third, it can be in a state of equilibrium. At equilibrium, there is little to no competition to buy or sell because the market is at a price where everyone can buy or sell as much as they want. However, as the market moves away from equilibrium, competition increases which forces price back to equilibrium. In other words, competition eliminates itself by forcing markets back to equilibrium. Even though equilibrium is where the majority of candles are, we don’t really want to trade in that area.
Principle 2: Any and all influences on price are reflected in price.
At any given moment there is a ton of financial information being created and passed on around the planet. This information can be in the form of an earnings report, news, income statement, analyst opinion, economic report, terrorist attack and so on. All this information creates thoughts and perceptions that are different for everyone depending on their individual belief system. Be careful to notice that most humans assume other’s belief systems are the same as their own. This, of course, is simply not true.
As I have said before, beliefs lead to ACTION; and in trading and investing, action is either buying or selling. Each action to buy or sell takes place at a specific price. Therefore, price is all that the consistently profitable trader and investor needs to focus on. Adding ANY other information will distort your perception of the supply/demand reality in any given market.
Principle 3: The origin of motion/change in price is an equation where one of two competing forces (buyers and sellers) becomes zero at a specific price.
The Candles on your screen represent the footprints of buyers and sellers. Each and every candle is created because of an ongoing demand and supply relationship. This order flow is driven by demand and supply based on people’s perceived value, fear and greed.
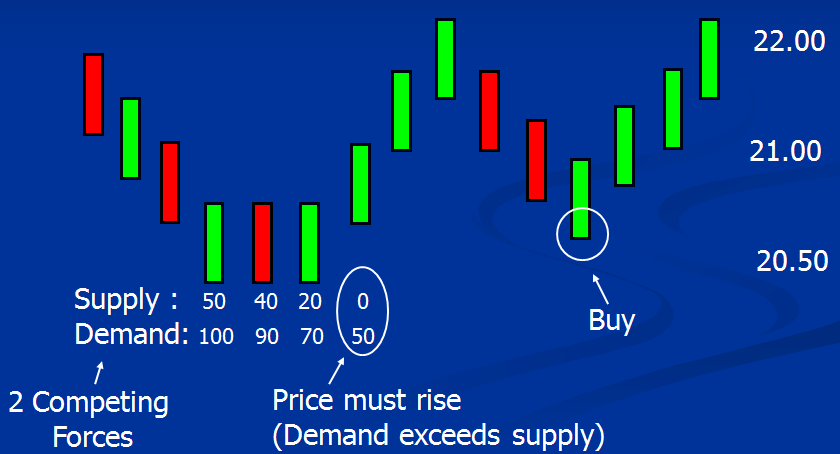
Let’s now put numbers to the simple supply and demand I keep mentioning. Here, we have 100 on the demand side and 50 on the supply side at price level: 20.50. Price will remain stable, meaning supply and demand will appear to be in equilibrium until the last sell order is filled. Price will then begin to increase or change when the last amount of supply is bought. It is when the last sell order is filled that we are left with 50 on the demand side and no sellers. One of the two competing forces has exhausted itself. In this case it was the sellers. What appeared to be supply/demand equilibrium was actually disequilibrium or imbalance; it just took a certain amount of time for this unbalanced equation to play out.
While everything in this piece only means something if you know what supply and demand looks like on a chart, the goal of this piece was to get you to turn back the clock and focus on the foundation of your trading and investing strategy. If there is any illusion or subjective information in your quest for truth, truth will never be found.
Hope this was helpful, Have a good day.
Information on these pages contains forward-looking statements that involve risks and uncertainties. Markets and instruments profiled on this page are for informational purposes only and should not in any way come across as a recommendation to buy or sell in these assets. You should do your own thorough research before making any investment decisions. FXStreet does not in any way guarantee that this information is free from mistakes, errors, or material misstatements. It also does not guarantee that this information is of a timely nature. Investing in Open Markets involves a great deal of risk, including the loss of all or a portion of your investment, as well as emotional distress. All risks, losses and costs associated with investing, including total loss of principal, are your responsibility. The views and opinions expressed in this article are those of the authors and do not necessarily reflect the official policy or position of FXStreet nor its advertisers.