Support and Resistance: What to Look For
|In my early days on the trading floor of the Chicago Mercantile Exchange working for a financial institution, I was always fascinated by the gap in the financial system between those who know what they are doing and profit, and those who don’t and lose money. It was really fascinating; big financial institutions and banks made so much money and were correct most of the time. At the same time, retail traders and investors were equally wrong most of the time and either lost tons of money or never came close to reaching their financial goals and profit objectives. If I could just figure out how and why a big bank made the trading decisions they did then maybe one day I could reap the same rewards was my thinking. I also spent time figuring out why retail traders performed so poorly; that was actually very easy to do. Without going into too much detail, I also realized that most retail traders and investors learned to speculate in markets the exact same way and commit the same simple mistakes over and over that inevitably led to their consistent losses. One thing I have paid close attention to in my many years of writing articles is to make sure I did not spend much time writing about popular concepts and strategies that most people learn and use from trading books, but instead to focus on real world trading and investing. If I did focus on popular strategies there would be no point in reading the article because those popular strategies tend to lead to losses not profits. To accomplish this, however, means suggesting ideas, concepts and strategies that sometimes fly in the face of conventional wisdom. What I have found over the years is that simply questioning anything conventional often exposes a flaw and, most importantly, opens the door of opportunity that so many people search for yet never find.
Today, let’s question conventional wisdom when it comes to price, market timing, volume and time itself. Specifically, I am referring to what happens to price at key market turning points. The goal of any market speculator is to identify where and when the market is going to turn, before it turns as well as where it is going to go, before it goes there. That is the only way to truly attain a low risk, high reward and high probability entry point into a market. To make a long story short, markets turn at price levels where supply and demand are “most” out of balance. In other words, the more out of balance supply and demand is at a price level the stronger the turn in price. So, how do we identify these levels on a price chart? A deeper lesson on this can be found in many of my prior articles. Today, let’s focus on one specific issue when it comes to identifying key supply and demand levels because, as we know, this is where prices turn. Time and volume are two important issues when it comes to conventional Technical Analysis found in trading books and the internet. For example, the Technical Analysis books tell us when looking for key “support” and “resistance” levels we should look for areas on the chart that have “plenty” of trading activity, many candles on the screen and “heavy” volume. They strongly suggest we should look for support and resistance levels that have many candles in the area and above average volume. This type of level on a chart to the eye does look good; but is this the best answer when attempting to identify key market turning points?
When you think the simple logic through I think you will find that conventional Technical Analysis has it wrong and the real answer is actually the opposite. We just concluded that the most significant turns in price will happen at price levels where supply and demand are most out of balance. Think about it, at price levels where supply and demand are most “out of balance,” will you see lots of trading activity or very little trading activity? If you said very little, you are correct. This is because of the big supply and demand imbalance. At that same price level you have the potential for the most activity but you don’t get much trading activity because all that potential is on one side of the market, the buy (demand) or sell (supply) side. So, what does this picture look like on a price chart? It’s not many candles on a screen like most trading books suggest, it’s actually very few. Furthermore, this picture is not going to include above average volume; it’s going to be lower volume most of the time.
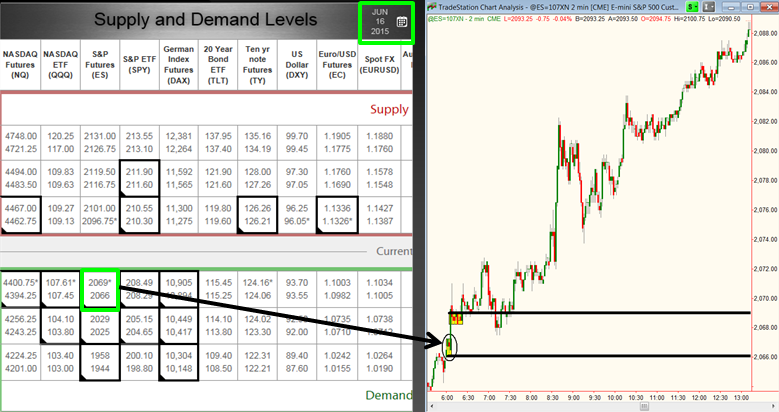
The example below is a trade from last week that represents exactly what I am suggesting in this piece. Notice the two demand levels shaded yellow. These levels were combined and added to our Supply/Demand grid that day as a demand level for our members to buy at. We will focus on the lower one that I have circled. This is demand because price could not stay there and had to rally away. But look at the number of candles in the demand level. It’s not ten, twenty or more… it’s four little candles and then price rallies strong. Ask yourself why price could only spend such a short amount of time at that level. The answer is because there was a significant supply and demand. If supply and demand were not so out of balance at that level, price would have spent more time in that area. Given that price spent so little time at that level, I concluded that there was a big imbalance and bought when price retraced back down to that demand level. I bought from a seller who thought the S&P was worth selling at that level. Maybe that seller read the trading books and ignored that demand level because the books say it’s not a key level due to such little activity. As you can hopefully now understand, that lack of activity is part of what makes it such a strong demand level.
Supply/Demand Grid – S&P Income Trade: 6/26/15
As I have said before, don’t be afraid to question something everyone believes to be true. If something doesn’t make logical sense, there is probably a better answer that does. By thinking the simple logic through you will almost always arrive at truth.
Hope this was helpful, have a great day.
Information on these pages contains forward-looking statements that involve risks and uncertainties. Markets and instruments profiled on this page are for informational purposes only and should not in any way come across as a recommendation to buy or sell in these assets. You should do your own thorough research before making any investment decisions. FXStreet does not in any way guarantee that this information is free from mistakes, errors, or material misstatements. It also does not guarantee that this information is of a timely nature. Investing in Open Markets involves a great deal of risk, including the loss of all or a portion of your investment, as well as emotional distress. All risks, losses and costs associated with investing, including total loss of principal, are your responsibility. The views and opinions expressed in this article are those of the authors and do not necessarily reflect the official policy or position of FXStreet nor its advertisers.