Where's Waldo?
|I remember, the first time I saw the series of Waldo books I was hooked. As I turned the pages finding him became harder and harder, but it was fun. So often I thought I saw his red striped shirt and glasses but nope, it was someone else. I also remember when I was a kid, the first time someone tried to point out the Little Dipper and other star formations in the sky. There were so many stars it was really hard to see what someone else saw so clearly. After a while I got it, like we all do, and it became easy to find almost any star pattern among millions of stars.
To properly buy and sell in financial markets we need to first know what we are looking for on price charts and then know what that pattern looks like. For example, when we buy into a market we need price to increase for us to profit. So the logical question is, where will price turn higher and where will it increase to? Price will stop falling and then increase at price levels where demand exceeds supply. So, that is what we need to look for on a price chart, a significant supply and demand imbalance on the demand side when buying, and on the supply side when selling. In other words, we look for where banks are buying and selling.
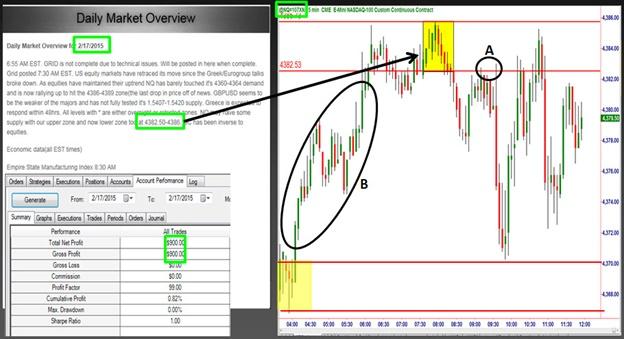
NASDAQ Income Trade: 2/17/15. Profit: $900.00
Let’s look at an income trade we took using one of our services at Online Trading Academy, the Daily Market Overview. The price action in the yellow boxes represents the picture of a supply and demand imbalance like we look for. The bottom is demand and the top is supply. The price action in circle “B” represents price moving, but not a supply and demand imbalance. In other words, it is irrelevant data in our search for key supply and demand. Much like Waldo and the Stars in the sky, you must be able to look at tons of price actions on a chart and know how to spot where banks are buying and selling and really ignore all other data. Over time, when you are good at it, the key levels just jump out at you.
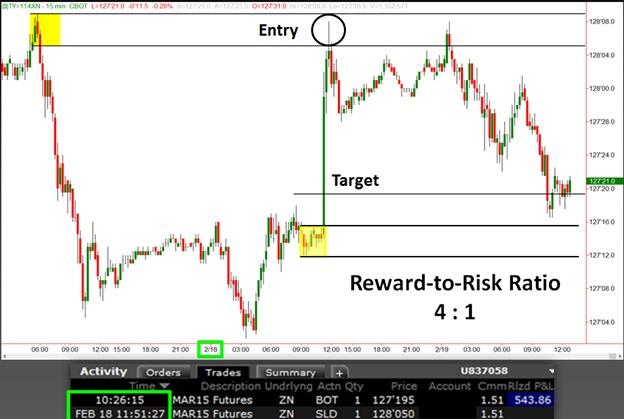
10 Year Note Income Trade: 2/18/15. Profit: $543.86
Here is another trade, the 10 Year Note with 1 contract. Again, the yellow boxes represent the picture of banks buying and selling, significant demand and supply. All the other candles on the chart DON’T represent that picture which means price should have an easy time moving through those areas. If I took the yellow boxes off the chart, like Waldo, the levels may be difficult to spot. It all comes down to three key things:
Learn to identify fresh demand and supply levels and then practice, practice, practice.
Focus on that picture and don’t let anything else creep into your buy and sell decision making process.
Keep it simple.
No matter how long it takes to find the little guy, Waldo is always somewhere on the page. Learning what he looks like and focusing on that picture, you will always find him. Banks and financial institutions are buyers and sellers in the markets each and every day. They leave very clear footprints when they are buying and selling. I started my career on this side of the business and one thing I experienced over and over is that we were hardly ever able to fill all of our biggest orders. Meaning, if we had 10,000 Yen to buy, we would maybe fill half that order and price would not come back. What I am showing above is the picture of those “unfilled” orders. These clear footprints are in front of us every day, you just need to know what you’re looking for. Lastly, keep in mind that all the information we are talking about here is equally applicable to short term trading for income and long term trading for wealth and, of course, any and all markets.
Hope this was helpful, have a great day.
Information on these pages contains forward-looking statements that involve risks and uncertainties. Markets and instruments profiled on this page are for informational purposes only and should not in any way come across as a recommendation to buy or sell in these assets. You should do your own thorough research before making any investment decisions. FXStreet does not in any way guarantee that this information is free from mistakes, errors, or material misstatements. It also does not guarantee that this information is of a timely nature. Investing in Open Markets involves a great deal of risk, including the loss of all or a portion of your investment, as well as emotional distress. All risks, losses and costs associated with investing, including total loss of principal, are your responsibility. The views and opinions expressed in this article are those of the authors and do not necessarily reflect the official policy or position of FXStreet nor its advertisers.