Planes, Trains, and Automobiles
|Planes, Trains and Automobiles is one of my favorite John Candy movies of all time. When I was a teen ager, I was an extra in another one of his movies (Only The Lonely) and got to meet him, big funny guy just like I expected. As funny as the movie is, there is a real story in it that all traders need to be aware of. I go through periods where I travel quite a bit and air travel can be draining because air travel means airports. Having status with an airline, knowing all the short cuts and tricks with lines and special seating helps but the experience can still be challenging at times. Once you’re air born however, there is little to complain about. Just sit back, relax and reach your destination. Driving to your destination is another story. Long airport lines are often replaced by stand still traffic, icy roads and maybe construction. You are also now the pilot so there is much more responsibility than flying. However, heated seats and a good sound system make driving a pleasure these days. Train travel is something I have not experienced much. My limited experience left me with the perception that it’s long (which is fine if you’re ok with that), relaxing and you get to see plenty of nature. Whether your destination is Florida or the North Pole, a plane, train or automobile can get you there.
Just like travel, there are many ways to reach your desired destination in trading. The chart below shows a recent swing trade from the Futures Extended Learning Track (XLT). The supply level was well placed on the supply/demand curve. Our “odds enhancers” exercise suggested this was a high probability opportunity as well. When price rallied up to our supply level for a short entry, spiked up into the level which made the shorting opportunity very ideal as the aggressive buying told us these were very novice buyers, price proceeded to fall to our target and the trade was complete. When I went over this opportunity with XLT members, I used the chart you see here which has only price on it. All the information we needed to identify and take advantage of this low risk and high reward opportunity is clearly seen with price and price alone. I made a quick $600 profit on the trade and, as you can see in the live chat box, some of our students profited as well.
Live Trading Room (Extended Learning Track, XLT) 12/5/14 – NASDAQ Futures Trade
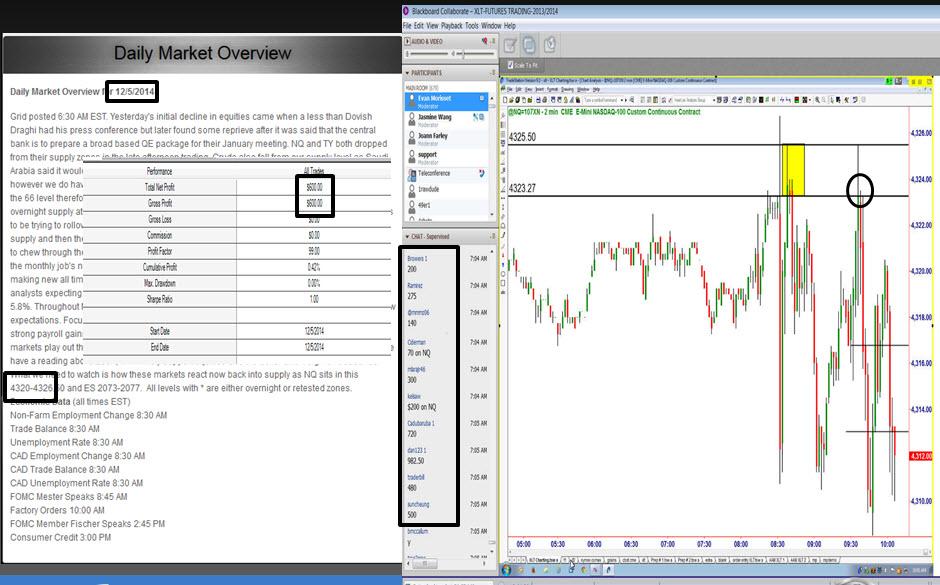
Some traders however are either not comfortable using only price action analysis or they desire more confirmation to take a trade. For this, people tend to use indicators and oscillators as the confirmation crutch. Let’s take a look at the same trading opportunity only this time lets add Bollinger Bands.
Same XLT NASDAQ Trade with Bollinger Bands
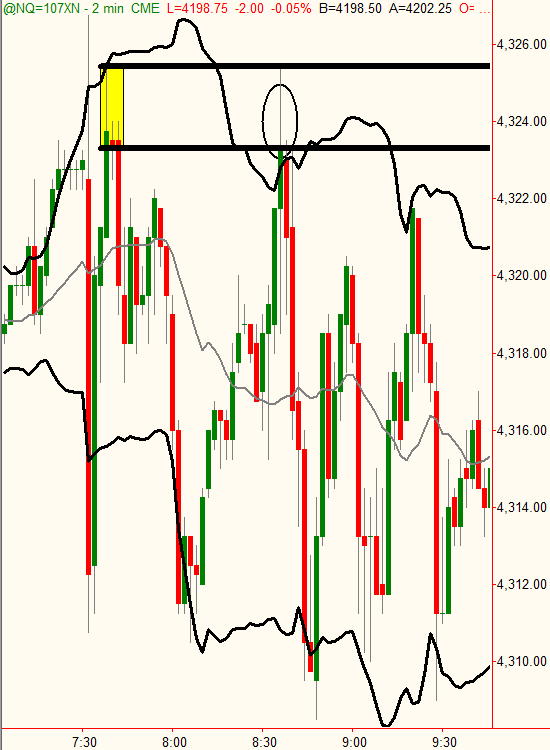
At the time of entry for our short position we see that price has actually pierced the upper Bollinger Band suggesting an overbought condition for the NASDAQ. Price piercing the upper band and reaching an objective supply level with a large profit target below suggests higher odds. Adding Bollinger Bands to this trading opportunity makes the trade more attractive and also points out a key ingredient when using Bollinger Bands; don’t just sell short because price is piercing an upper band, take action because price is piercing the upper band AND price has reached a supply level.
Same XLT Trade with Commodity Channel Index (CCI)
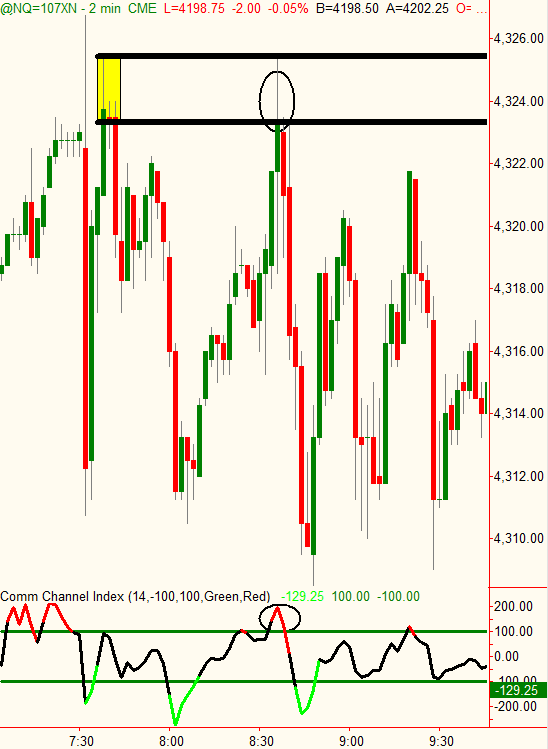
Lets again look at the same shorting opportunity and add the Commodity Channel Index (CCI). This is an overbought (+100 or greater)/oversold (-100 or greater) oscillator. Notice at the time of our short entry, CCI was giving an overbought reading again suggesting this was a high odds opportunity to sell short. Notice the overbought CCI reading I circled. This is in line with our short entry which makes CCI look attractive as a decision making tool. However, look just to the left of that circle and you will see other overbought readings where price didn’t turn lower. The reason is because price does not turn lower because CCI is overbought, it turns lower because it has reached a price level where supply exceeds demand. As for using it for confirmation, it’s a decent secondary decision making tool but nothing we would ever consider for a primary decision making tool simply because it does not focus on the real buy and sell orders in the market.
Same XLT Trade with Slow Stochastic
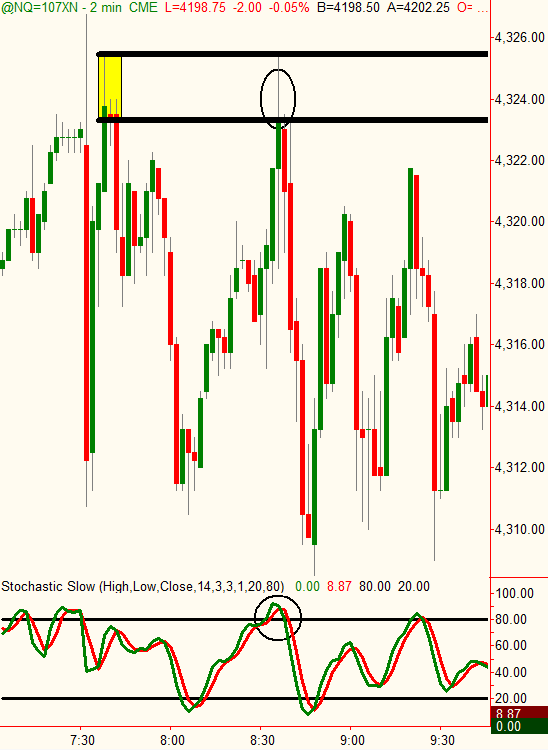
Last but not least, let’s add Slow Stochastics to our successful NASDAQ trade. Stochastics are a very popular overbought/oversold oscillator. The typical buy and sell signals are a moving average (red and blue lines) cross in overbought and oversold territory. Did the Stochastics sell signal line up with our price action sell signal? Yes. Did we need Stochastics for this trading opportunity? No.
The most important point here is that while indicators and oscillators can assist in ones “comfort” level, these can’t be used as primary decision making tools because of the many flaws in their design. These tools don’t know anything about supply and demand. It’s not that they are broken or don’t work. They are mathematically generated lines on your chart. The math is always correct. Whether that math leads to profits or losses in your trading account is the question most novice traders never ask, and it happens to be the only question that matters.
As John Candy showed us, in travel there are many ways to reach our destination. Trading is only slightly different. While you can use indicators and oscillators as confirmation tools, if you are NOT filtering these buy and sell signals through real demand and supply levels you are traveling east and west trying to reach that North Pole, good luck with that. If you must use indicators and oscillators, go ahead and use them. Again, just make sure you filter those signals they spit out through proper supply and demand analysis. If I just repeated myself three times, it’s only because it’s so important and we at Online Trading Academy care about you and your financial well being.
Hope this was helpful, have a great day.
Information on these pages contains forward-looking statements that involve risks and uncertainties. Markets and instruments profiled on this page are for informational purposes only and should not in any way come across as a recommendation to buy or sell in these assets. You should do your own thorough research before making any investment decisions. FXStreet does not in any way guarantee that this information is free from mistakes, errors, or material misstatements. It also does not guarantee that this information is of a timely nature. Investing in Open Markets involves a great deal of risk, including the loss of all or a portion of your investment, as well as emotional distress. All risks, losses and costs associated with investing, including total loss of principal, are your responsibility. The views and opinions expressed in this article are those of the authors and do not necessarily reflect the official policy or position of FXStreet nor its advertisers.