Great Technical Analysis Question
|I received an email with a question regarding my opinion of indicators and chart patterns. I began to reply to the email and then stopped. I thought, if this reader has this question, perhaps others do as well. Given that many short term traders lose money and that most long term investors never come close to achieving their long term financial goals, I felt it was my responsibility to give my honest opinion of conventional chart patters and indicators from the world of technical analysis.
First, let me take you back to when I initially learned how the trading markets worked and how money is really made and lost in the markets. In short, how to properly speculate in markets. Starting on the floor of the Chicago Mercantile Exchange (CME), I was responsible for facilitating institutional order flow. Each morning I would take buy and sell orders from banks, institutions, money managers, hedge funds, and some retail traders. I would have huge buy (demand) and sell (supply) orders in front of me all day. Each day price would move from demand to supply and back again… Anyone who made money would be either buying where demand exceeded supply for a long position or selling short at price levels where supply exceeded demand. In other words, anyone I saw who made money trading and investing would be buying at wholesale prices and selling at retail prices, period. People who lost money simply took the opposite action.
Fast forward to today, nothing has changed, this is and will always be how you make money buying and selling anything. This picture of bank and institution demand and supply is exactly what we teach our students to see on price charts so they can buy at wholesale prices and sell at retail prices. Anyway, this is how I learned to trade and this is exactly what my brain is focused on, really buying low and really selling high.
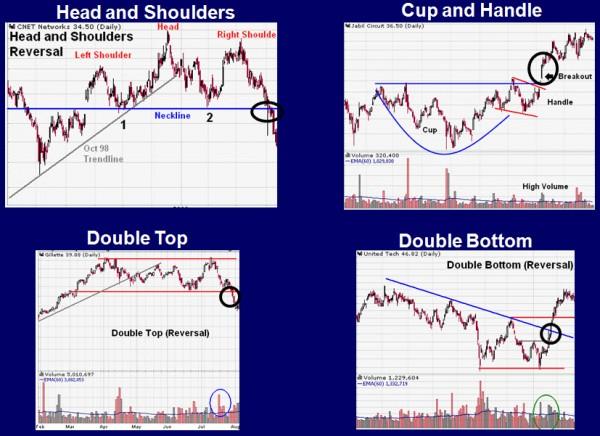
Months into my career at the CME, I was walking to lunch with a friend of mine from the trading floor. He said, “The markets are going to go higher tomorrow.” I said, “Oh, why?” He replied and told me the Stochastics were doing this and the MACD was doing that and so on. We were on our way to lunch so when he said MACD, my first thought was Mc Donalds because I was hungry. I stopped him mid sentence and told him I didn’t understand what he was talking about. I had never heard of any of that stuff. He said, “Technical analysis.” I said, “What’s that?” He explained a bit but I didn’t understand and I was more focused on getting lunch… A few days later, he took me into the CME library and showed me a technical analysis book. I flipped though it for the first time and my first thought was how ridiculous the information was. I looked at him and asked, “Who would use these strategies?” My friend said, “Everyone.” To illustrate why I thought that way, take a look at the chart patterns below that are in just about every trading book ever written. The Head and Shoulders, Cup and Handle, Double Top, and Double Bottom. There are many more but I thought I would share the most popular ones in the history of conventional technical analysis.
Conventional Chart Patterns
When you look at all these, notice the circled areas. The circles represent where the entry points are for these patterns. The big question is this, what do they all have in common? Notice they all have you buying AFTER a big rally in price and selling AFTER a big decline in price! In my world and any one I knew that made money trading, we did exactly the opposite and still do today. To me, all the information in the book was a recipe for losses, not gains. Why in the world would you wait for price to rally that much before buying or wait for such a big decline (or any decline at all) before selling? This made absolutely no sense to me. I was conditioned to do the opposite from my experience in real work trading and investing.
During the years that followed, I really began to understand why most active retail traders lose money and why most long term investors never achieve their financial goals. It’s because they are taught completely backwards. In fact, everything in this book had you buying after a rally in price and selling after a decline in price. You would never take that novice action when buying and selling anything else in life and profit and the financial markets are no different. Do you think Goldman Saches sits around looking for Head and Shoulder patterns? Do you think they make their billions in profits waiting for price to rally and form a Cup and Handle before buying? They laugh at the trading books just like we did on the trading floor.
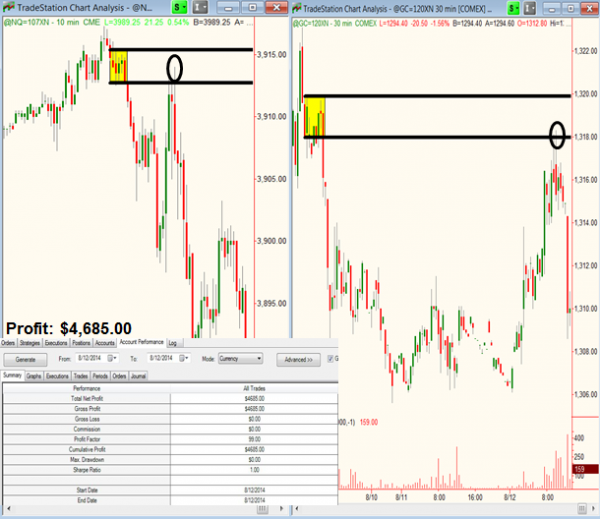
Let’s take a look at two trades I took last week in our program to illustrate the point and so you can learn from it if you so choose. The yellow boxes represent supply levels (retail prices) where financial institutions are selling and have plenty of unfilled sell orders, our strategy rules tell us so. The circles represent the short entries where I sold to retail traders who were buying. Our rule based strategy also told us significant demand was not until much lower which offered a nice profit zone and risk/reward.
Nasdaq and Gold Income Trades, 8/12/14. Total Profit for day: $4,685.00
Had I added any indicators to this trading opportunity, none would have been giving sell signals at supply. When price reached supply for the short entry, every moving average is still pointing up and so on. None are giving sell signals at all. Once prices turn lower all the indicators begin giving sell signals but for me, that’s way too late to start selling as the risk is much higher and reward is reduced.
The key is to both think like a bank and institution and act like one when trading and investing. To make an already long story short, I don’t use indicators and oscillators in my trading and we don’t focus on them at Online Trading Academy. They lag price which means that if we add anything to our decision making process that lags price, we are only increasing risk and decreasing profit margin.
Hope this was helpful. Have a great day.
Information on these pages contains forward-looking statements that involve risks and uncertainties. Markets and instruments profiled on this page are for informational purposes only and should not in any way come across as a recommendation to buy or sell in these assets. You should do your own thorough research before making any investment decisions. FXStreet does not in any way guarantee that this information is free from mistakes, errors, or material misstatements. It also does not guarantee that this information is of a timely nature. Investing in Open Markets involves a great deal of risk, including the loss of all or a portion of your investment, as well as emotional distress. All risks, losses and costs associated with investing, including total loss of principal, are your responsibility. The views and opinions expressed in this article are those of the authors and do not necessarily reflect the official policy or position of FXStreet nor its advertisers.