Floor and Ceiling for the NASDAQ
|The Path of Least Resistance
When an object is in motion, the range of that motion is typically very clear. Take a ball for example. If I am standing in a room and I throw the ball up to the ceiling, I know it will hit the ceiling and fall to the floor. If the ceiling is 10ft high and I throw the ball up from a height of 5ft, it will rise 5ft and fall 10ft. I think it’s reasonable for me to assume we can all agree with this scenario. We can all agree because we all understand gravity and can see the floor and ceiling. The key is the word “see.” Imagine if you could “see” the floor and the ceiling in market prices with a very high degree of accuracy. Exploring this using an Extended Learning Track (XLT) trading opportunity from last week is the focus of this piece.
At home, you may have a hard wood floor and a ceiling made of dry wall or some fancy wood. In the markets, the floor and ceiling are simply demand and supply or in simple terms, unfilled buy and sell orders. Figuring out where price is going to turn and where it is going to go is not that hard if you know what you’re looking for on the chart.
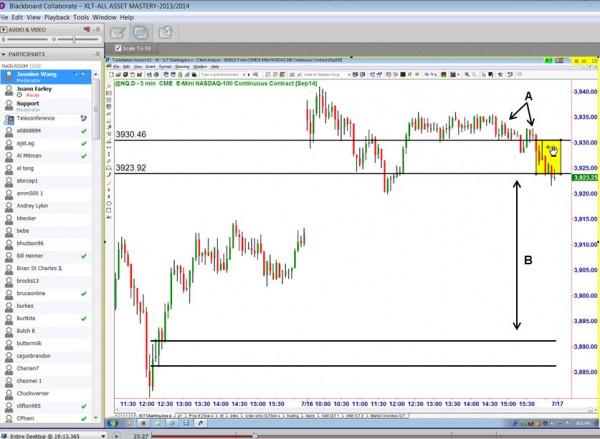
Live Trading Room Trade Setup: NASDAQ – 7/17/14
During a live trading session with our students in the XLT, an opportunity arose in the NASDAQ Futures. Price was basing sideways, not really moving up or down that much in the yellow box area. Where was it likely to move from that level? Think of the ceiling and the floor… Where are the unfilled buy (floor) and sell (ceiling) orders? Our “A” on the chart is a price level where when price was trading at that level, it could not remain there. It fell from that level simply because supply exceeded demand at that level. Once the last buy order was filled at that level, there were still sell orders left and when that equation is present, price always has to decline and it did. So, while I would never call area “A” a significant supply level, there were some unfilled sell orders in that area which is why price declined and started basing in that yellow shaded range. Next, where would price move from there? Well, so far we know that we have some supply (ceiling, “A”) above. We also know that the chart is telling us the demand (floor) is much lower. “B” represents the distance between demand and supply, the floor and the ceiling. There is no price action in the range labeled “B” that represents demand so we would expect price to move down through that level. The screen shot is from the live session; that’s what the chart looked like in real time for our XLT students. So, once we know where the floor and ceiling is, we can play ball or if you are trading the financial markets, we can place trades, the logic and equation is the exact same.
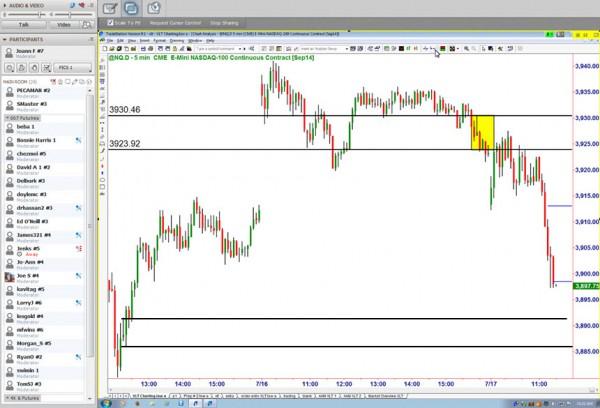
Live Trading Room Trade Result: NASDAQ – 7/17/14
Once you have all the information you need, it’s time to execute your plan with no thinking or emotion involved. Once price declined from that level as expected, it rallied back to the supply level (yellow box) and proceeded to decline and reach the profit targets we had for this trade (blue lines). Notice price declined rather quickly through that area. It did this because there was simply no floor (demand) to stop it. Your confidence in bouncing a ball is there because you can see the floor and ceiling. You can also see the buy (demand/floor) and sell (supply/ceiling) orders on a price chart in any market and time frame if you know what you’re looking for.
Hope this was helpful. Have a great day.
Information on these pages contains forward-looking statements that involve risks and uncertainties. Markets and instruments profiled on this page are for informational purposes only and should not in any way come across as a recommendation to buy or sell in these assets. You should do your own thorough research before making any investment decisions. FXStreet does not in any way guarantee that this information is free from mistakes, errors, or material misstatements. It also does not guarantee that this information is of a timely nature. Investing in Open Markets involves a great deal of risk, including the loss of all or a portion of your investment, as well as emotional distress. All risks, losses and costs associated with investing, including total loss of principal, are your responsibility. The views and opinions expressed in this article are those of the authors and do not necessarily reflect the official policy or position of FXStreet nor its advertisers.