For Successful Trading and Investing You Need A Profit Zone
|So often in the trading world, I hear people talk about where price is likely to turn next, where is the next key supply or demand level, where is the next big market move going to originate from, and so on. The question I hardly ever hear anyone asking is, “Where is the next big profit zone?” This is one of if not the most important things to consider when speculating in markets.
The profit zone is the distance in price between the entry point and the profit target price. When looking for trading opportunities, people tend to focus on where the next big turn in price will happen. As I often write about, these turns happen at price levels where supply and demand is out of balance. When looking at charts, you will find that there are many supply and demand levels. By no means are we interested in taking trading opportunities at all the levels we find. In fact, when considering profit zone into the filtering mix, we would ignore most of the supply and demand levels we find and narrow our focus down to the supply and demand levels that have large profit zones associated with them.
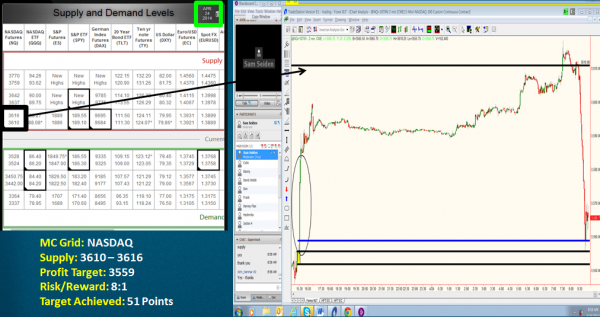
To explain the concept of profit zone and its importance in trading, let’s take a look at a trading opportunity from the Mastermind Supply and Demand Grid and a live trading session I led last week for our students. Here we are looking at a small time frame chart of the NASDAQ from last week. The black line near the top of the chart is extended from a strong fresh supply zone not seen on the chart. This is where we expected there to be more willing supply than demand. The chart suggested that banks were selling in this area as noted on the supply/demand grid. The circled area on the chart is the “profit zone” which means there is no demand to stop price from moving through that area. The trading opportunity was to sell short at the supply level and profit from a downside move through that circled area to the demand level below. Also, if you’re wondering about all the price action above that circled area, that is not demand at all. We expect price to move right through that area.
The key element here is to identify where the demand and supply is, then look at current price, and finally determine the “path of least resistance” as that is where the next move in price is likely to go. Meaning, price is likely to have a relatively easy time moving through that circled area, the profit zone because there are no buy orders to stop it, the price action tells us this. Keep in mind a VERY important point here: We are coming to all these conclusions BEFORE we enter the trade. You must perform your analysis in advance and make your decisions before it’s time to push the button or this will never work.
As I mentioned earlier, there are many supply and demand levels on a chart and many large and small profit margins. The key for the astute trader is to be able to identify objective supply and demand levels. Then and only then will you be able to find supply and demand levels that have huge profit zones associated with them. What I do is ignore most supply and demand levels on a chart and only focus on the ones that have a great distance (huge profit zone) between them. This does two things. First, it obviously offers an attractive risk /reward opportunity. Second and just as important, the larger the profit zone, the greater the probability of the trade working out. This is because when you have a big profit zone, by definition your supply and demand levels are far out on the supply and demand curve. Entering your trades at market price extremes increases the probability of success.
To better understand the concept of profit zone in trading, think of profit margins in any other business. Think of how companies who sell products determine what to sell. Most of the decision if not all of it comes down to profit margin. Think about companies who produce products and how they decide what to produce. Most if not all of that decision comes down to profit margin. The decision on which trading opportunities to put your hard earned money at risk on is absolutely no different and in fact, we chart profit margin the same way as any successful company would.
Hope this was helpful. Have a great day.
Information on these pages contains forward-looking statements that involve risks and uncertainties. Markets and instruments profiled on this page are for informational purposes only and should not in any way come across as a recommendation to buy or sell in these assets. You should do your own thorough research before making any investment decisions. FXStreet does not in any way guarantee that this information is free from mistakes, errors, or material misstatements. It also does not guarantee that this information is of a timely nature. Investing in Open Markets involves a great deal of risk, including the loss of all or a portion of your investment, as well as emotional distress. All risks, losses and costs associated with investing, including total loss of principal, are your responsibility. The views and opinions expressed in this article are those of the authors and do not necessarily reflect the official policy or position of FXStreet nor its advertisers.