The Two Most Important Pictures On A Chart
|The goal for most traders is consistent profits, life-long income from speculating in markets. The key word in that sentence is “consistent.” Anyone can have profitable trades here and there, but do they produce consistent income and profits from trading? I have a friend who day trades the S&P Mini and has a winning percentage of around 80% but the problem is, he doesn’t make consistent income from trading. Sounds crazy I know, but one loss for him tends to wipe out all of the profits (hope he doesn’t read this article)…
In the Extended Learning Track (XLT), one of the “Odds Enhancers” we focus on for every short term and long term trading opportunity is Profit Zone. Without a path for price to move after we enter a position on the chart, there is no trading opportunity. What we are looking for are supply and demand levels with very little activity between them. There are many supply and demand levels on a chart. Often, there is a very quality supply and demand level on a chart but the problem is, they are too close to each other or there is too much trading activity between them which again means no trade. Typically, we are looking for opportunities on the chart that offer us at least 3:1 reward to risk to the first target. Often we are looking for more but this is a safe minimum to make a trade acceptable to take.
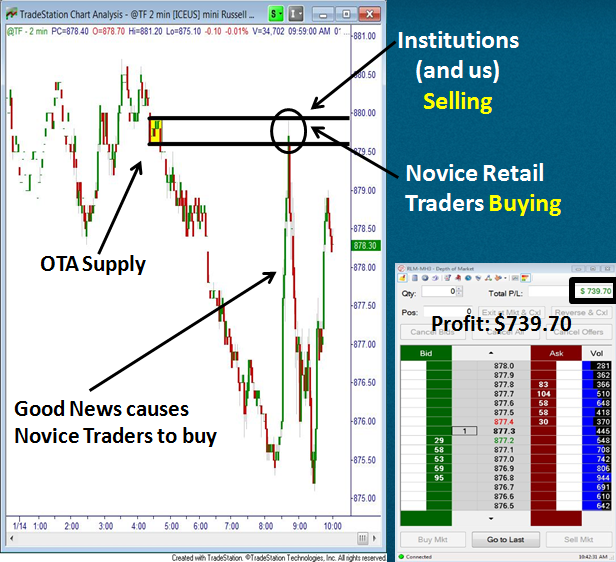
At this point, you’re probably wondering what any of this has to do with the title of the article. Let me explain through a trade we took that we found in the Extended Learning Track (XLT). This was a trade in the Russell (TF). Notice the supply level on the chart, shaded in yellow. The supply level is the origin of a strong decline in price and has with it some very key Odds Enhancers that make this a significant level where institutions are likely selling, where supply greatly exceeds demand. The trade was to bet on a downside move, selling short at the supply level to a novice buyer for a potential move down in price. What made this trade work well are two specific things. First was the quality supply level. Second, notice the rally that brought price up to the supply level where we sold short. There was good news, people started buying in a hurry, and price shot up quickly. Notice specifically the big green candles. There is no picture of demand in that rally. This means that when price reached the supply level where we sold short, price was likely to fall just as fast as it rallied because there was no significant demand to stop it from falling. Lets go over these two most important pictures on a chart so that you can start seeing this picture of opportunity also:
1) Quality Supply and Demand Levels: To identify market turning points and market moves in advance with a high degree of accuracy, you need to be able to know where institutions and banks are buying and selling in the markets. To accomplish this, you must be able to quantify real supply and demand in a market. For this, a solid understanding of the Odds Enhancers is key. To summarize… One of the two most important pictures on a price chart is a quality supply or demand level.
2) A Clear Profit Zone: Just as it is important to identify strong supply and demand levels on a chart. It is equally important to be able to identify areas on the price chart where there is very little supply or demand. These are the areas where price will move quickly through.
Everything you need to see is on the price charts, if you know what you’re looking for. If you have been schooled in the theories of conventional technical analysis, you may be blinded by illusions of chart patterns that never really worked for anyone. Have no fear, there is a cure. Remove everything from your charts but price and price alone. Next, read next week’s article and I will take things back to basics and help you identify real demand and supply on price charts. My hope is that today’s little nugget of information helps you achieve the consistency you’re looking for.
Have a great day.
Information on these pages contains forward-looking statements that involve risks and uncertainties. Markets and instruments profiled on this page are for informational purposes only and should not in any way come across as a recommendation to buy or sell in these assets. You should do your own thorough research before making any investment decisions. FXStreet does not in any way guarantee that this information is free from mistakes, errors, or material misstatements. It also does not guarantee that this information is of a timely nature. Investing in Open Markets involves a great deal of risk, including the loss of all or a portion of your investment, as well as emotional distress. All risks, losses and costs associated with investing, including total loss of principal, are your responsibility. The views and opinions expressed in this article are those of the authors and do not necessarily reflect the official policy or position of FXStreet nor its advertisers.