ATR Gauges the Gas Is Left in the Price Tank
|As traders we all want to find the highest probable turning points in the markets. At Online Trading Academy, our students learn how to find them through the discovery of high quality supply and demand zones. In addition to the zones, there are several Odds Enhancers that we teach that traders can use to increase their probability of success in the markets.
One odds enhancer is similar to a fuel gauge, the Average True Range, (ATR). A fuel gauge in a car tells you how much gas you still have left. If you know your average miles per gallon for the car, you can figure out how far you can still travel without running out of gas. The ATR can tell you how much price movement you may experience before you run out of momentum.
The range of a stock’s price is the difference between the high price and the low price during a period of time. The true range is a little different in that it also includes any gapping that may have occurred from the prior period. So, the Average True Range measures the stock’s price vibration (average movement between high and low) over a period of time. The default is usually 14 periods.
The ATR of a stock will differ based on the period you have your chart set for. If you are viewing a daily chart, the ATR will refer to the average movement that stock will make between the high and the low for the day. If you have your charts set for 15 minutes, then you will see the average movement for every 15 minute period.
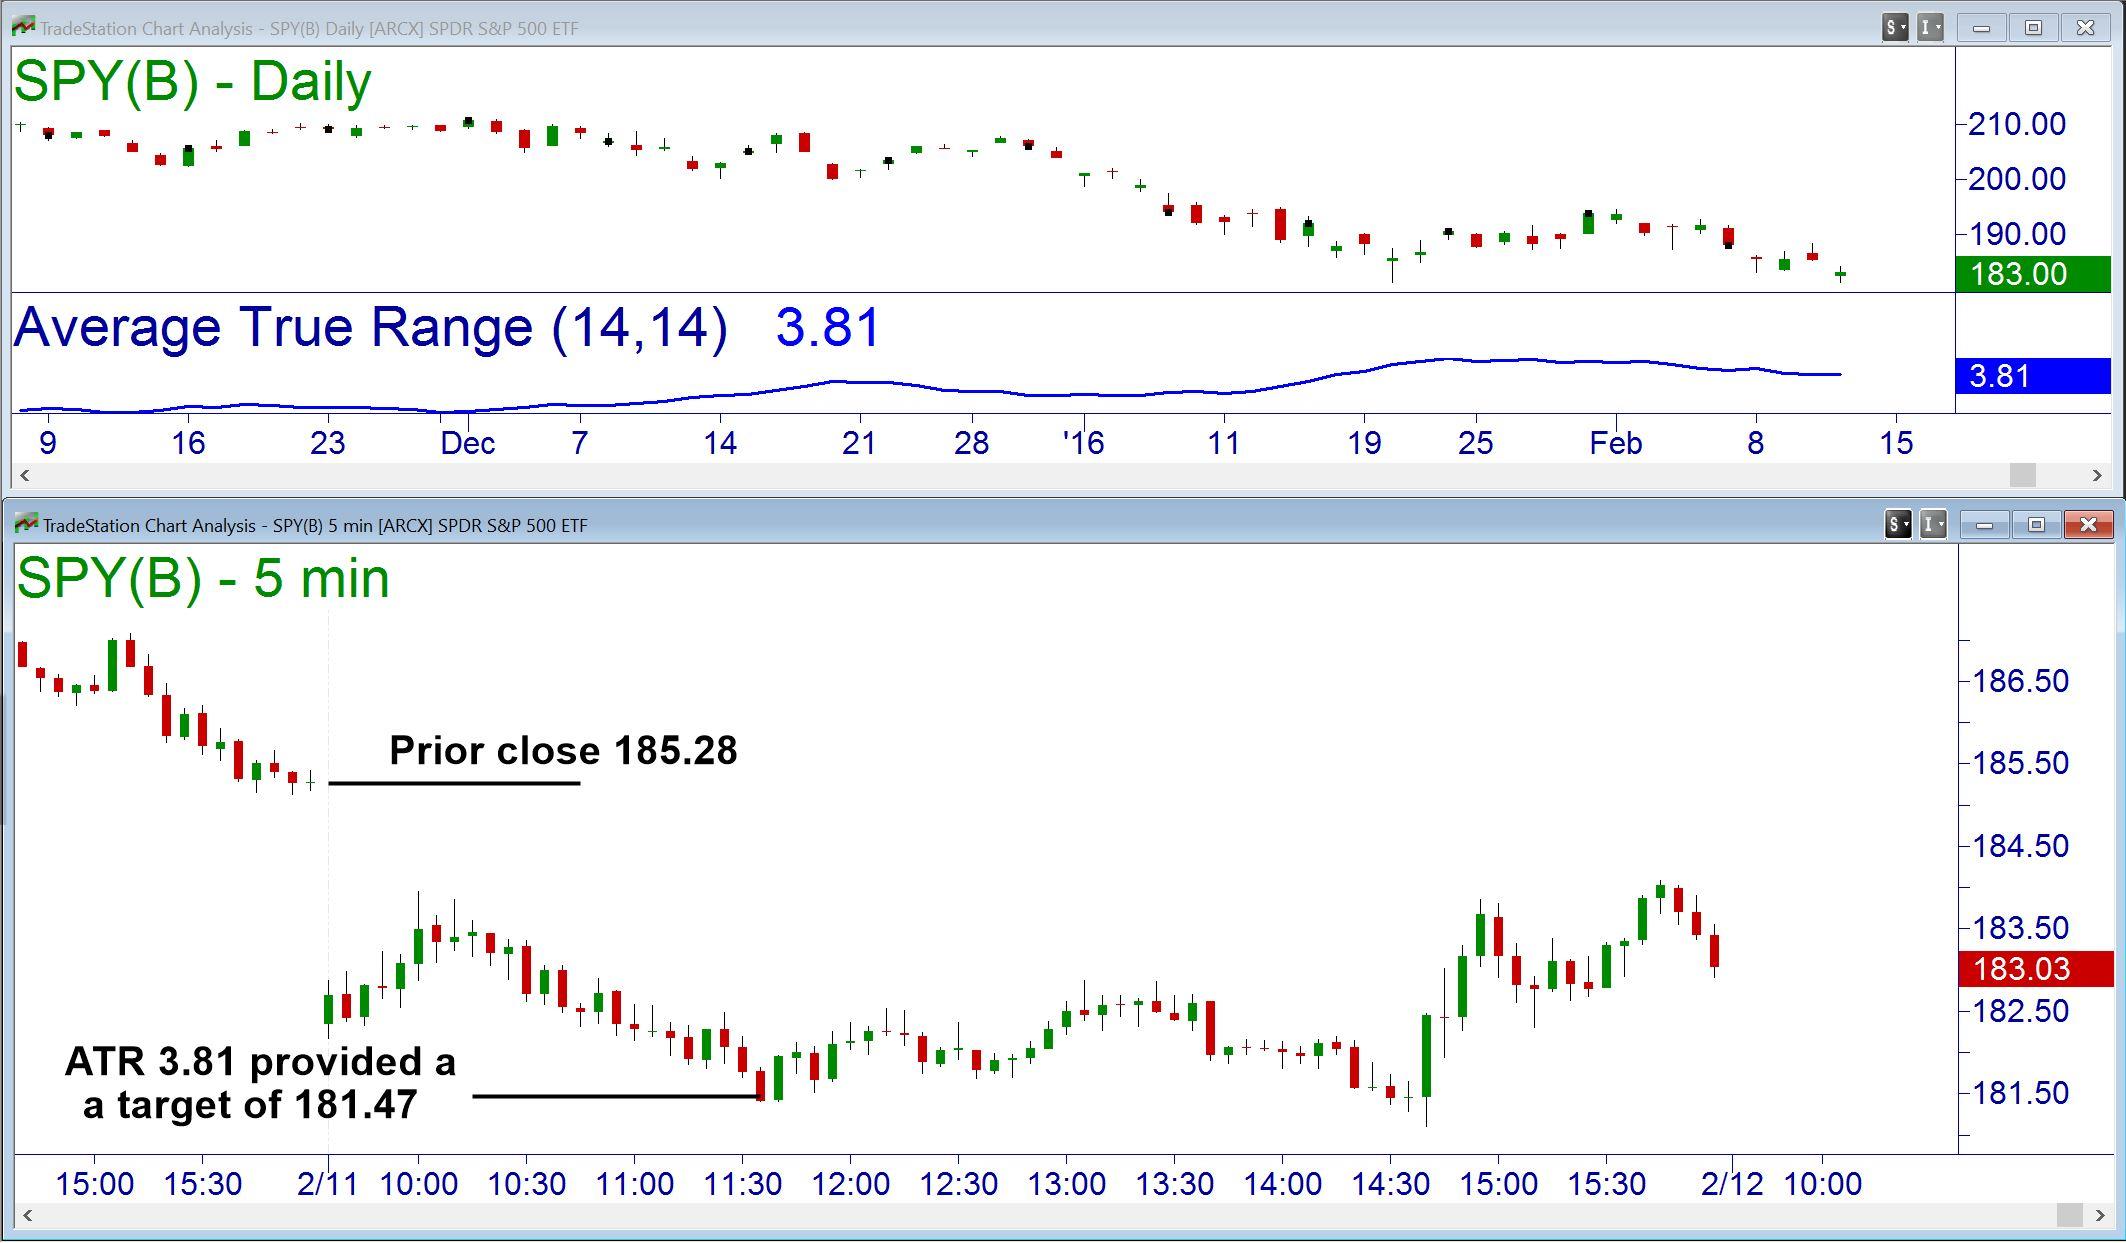
When price is trending strongly in a particular direction, knowing the ATR for that timeframe can offer you a clue as to when price may pause or reverse. For instance, in the following picture, the daily ATR for SPY was $3.81. If you subtracted that from the prior day’s close of $185.28, you knew that the morning gap and price drop would likely see a pause when it reached the daily ATR range.
Additionally, when price reaches a supply or demand zone beyond the ATR, it is more likely to reverse. Price may still have plenty of momentum when it reaches a supply or demand within the ATR.
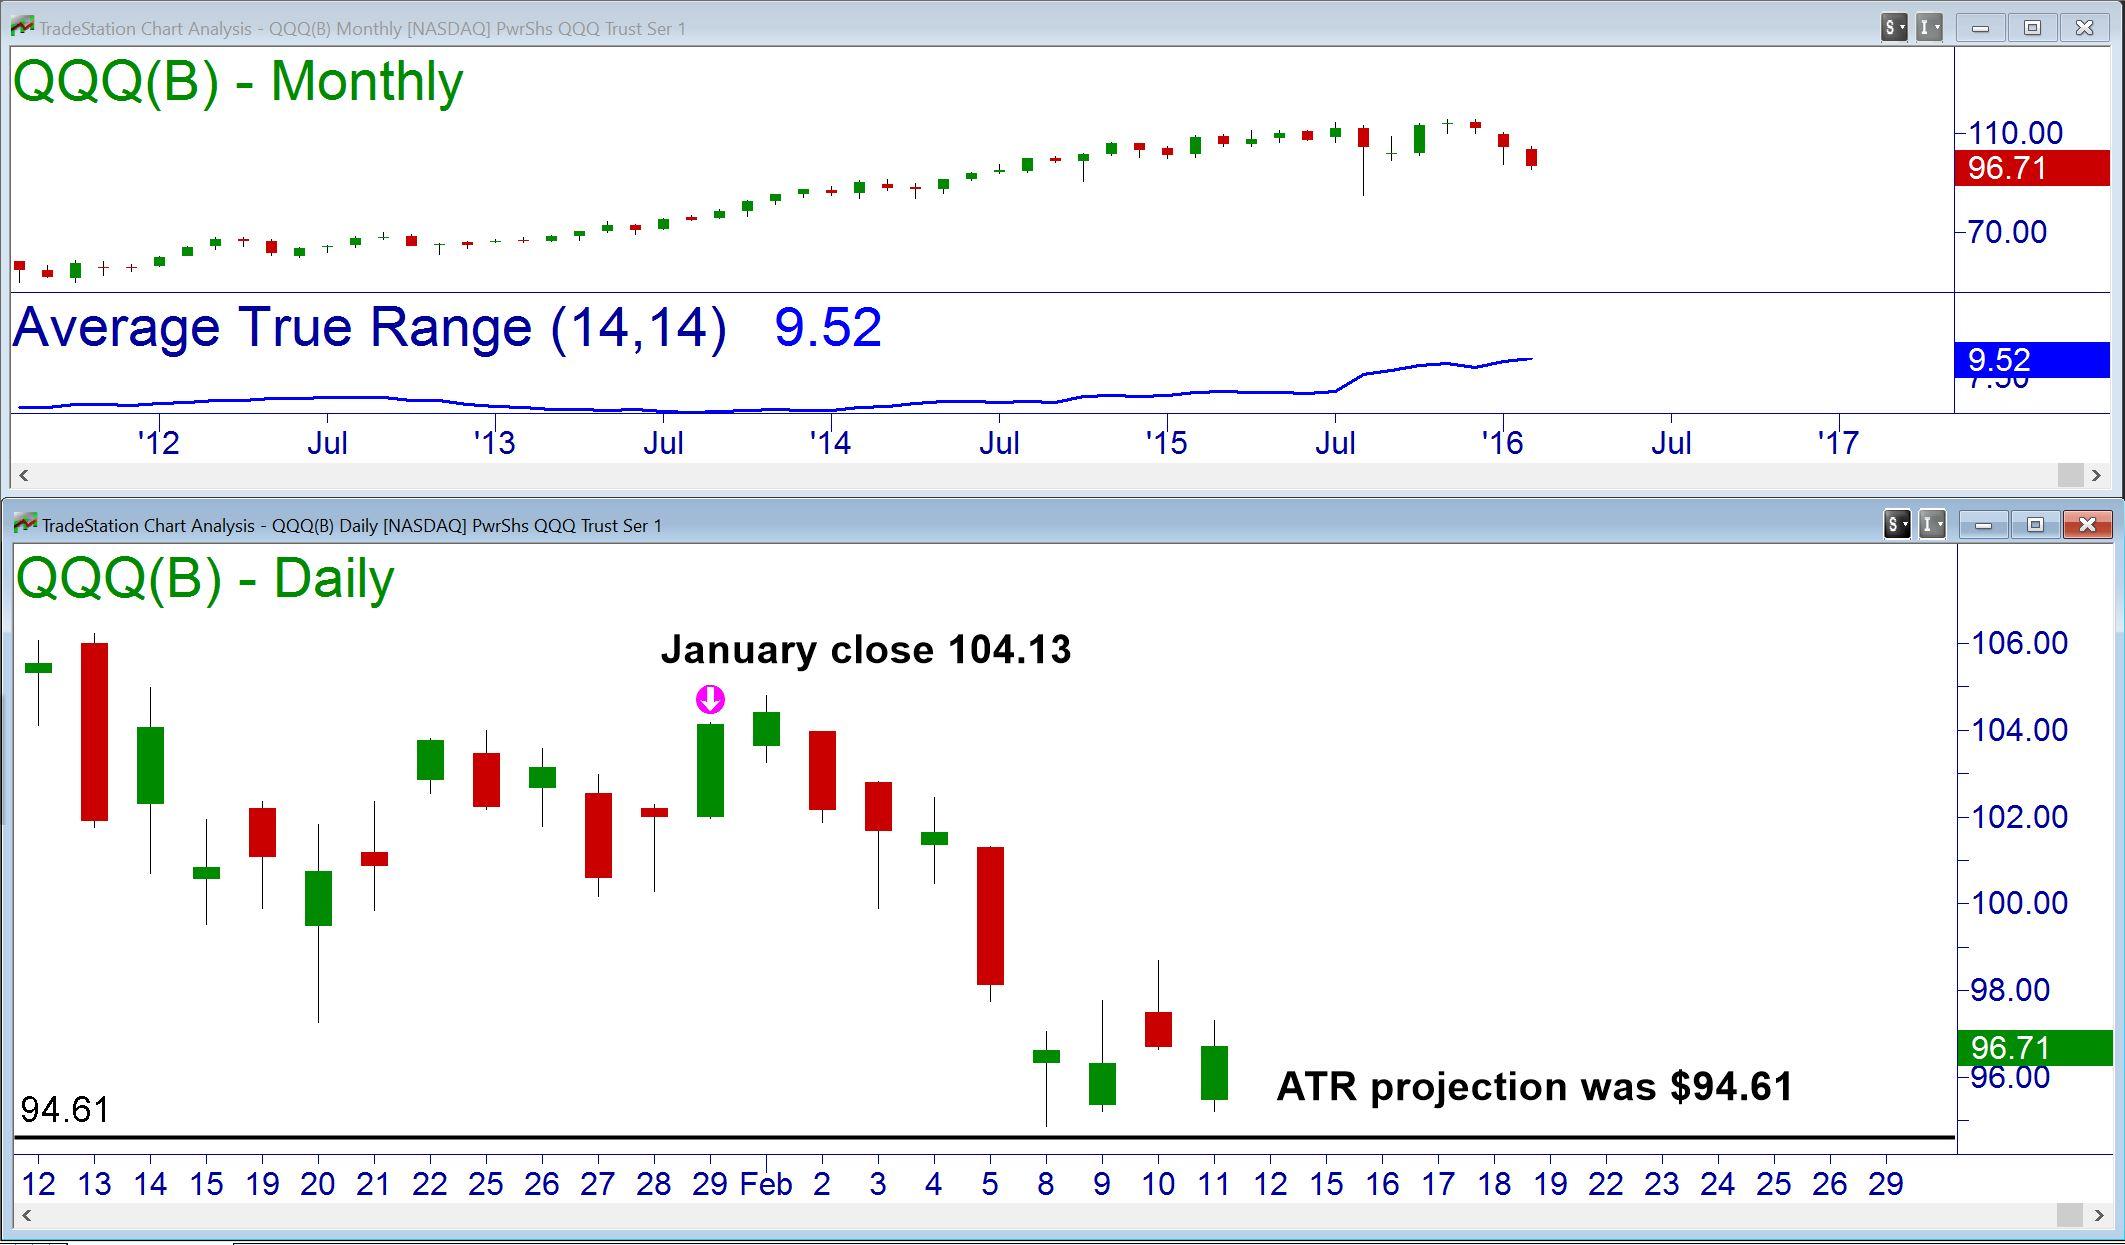
We can even use this ATR on a larger timeframe. Last month’s ATR for the Q’s was $9.52. At the close of January, QQQ finished at $104.13 and started to sell off in February. Subtracting the ATR to the closing price of the previous month, we arrived at a target of $94.61 for the monthly trend of the Q’s. After opening positive on the first day of the month, prices dropped until they were just shy of the ATR target. As of the writing of this article, price has lost its downward momentum and has been basing at that ATR target.
So, while it is not a perfect timing tool for the markets, the ATR can be used to enhance our trading. It is an odds enhancer for traders. To learn about the other odds enhancers, join us in one of our classes at Online Trading Academy today!
Information on these pages contains forward-looking statements that involve risks and uncertainties. Markets and instruments profiled on this page are for informational purposes only and should not in any way come across as a recommendation to buy or sell in these assets. You should do your own thorough research before making any investment decisions. FXStreet does not in any way guarantee that this information is free from mistakes, errors, or material misstatements. It also does not guarantee that this information is of a timely nature. Investing in Open Markets involves a great deal of risk, including the loss of all or a portion of your investment, as well as emotional distress. All risks, losses and costs associated with investing, including total loss of principal, are your responsibility. The views and opinions expressed in this article are those of the authors and do not necessarily reflect the official policy or position of FXStreet nor its advertisers.