Tips for Trend Trading
|Many people have the misconception that trading has to be complicated since so few people are truly successful at it. Truthfully, people fail at trading because they over-complicate trading. Trading is not easy by any measure. However, it is simple. Online Trading Academy’s core strategy depends upon a simple, proven approach that works by trading the way that institutional firms trade.
Take the trend identification for instance. Successful traders are aware of the importance of identifying the dominant trend for your trading time frame as well as the larger time frame. In our courses, we use the definition of a trend to help decide the direction in which trading would be most profitable. Identifying and trading in the direction of the dominant trend will put you on track for more profitable trades and reduce your risk.
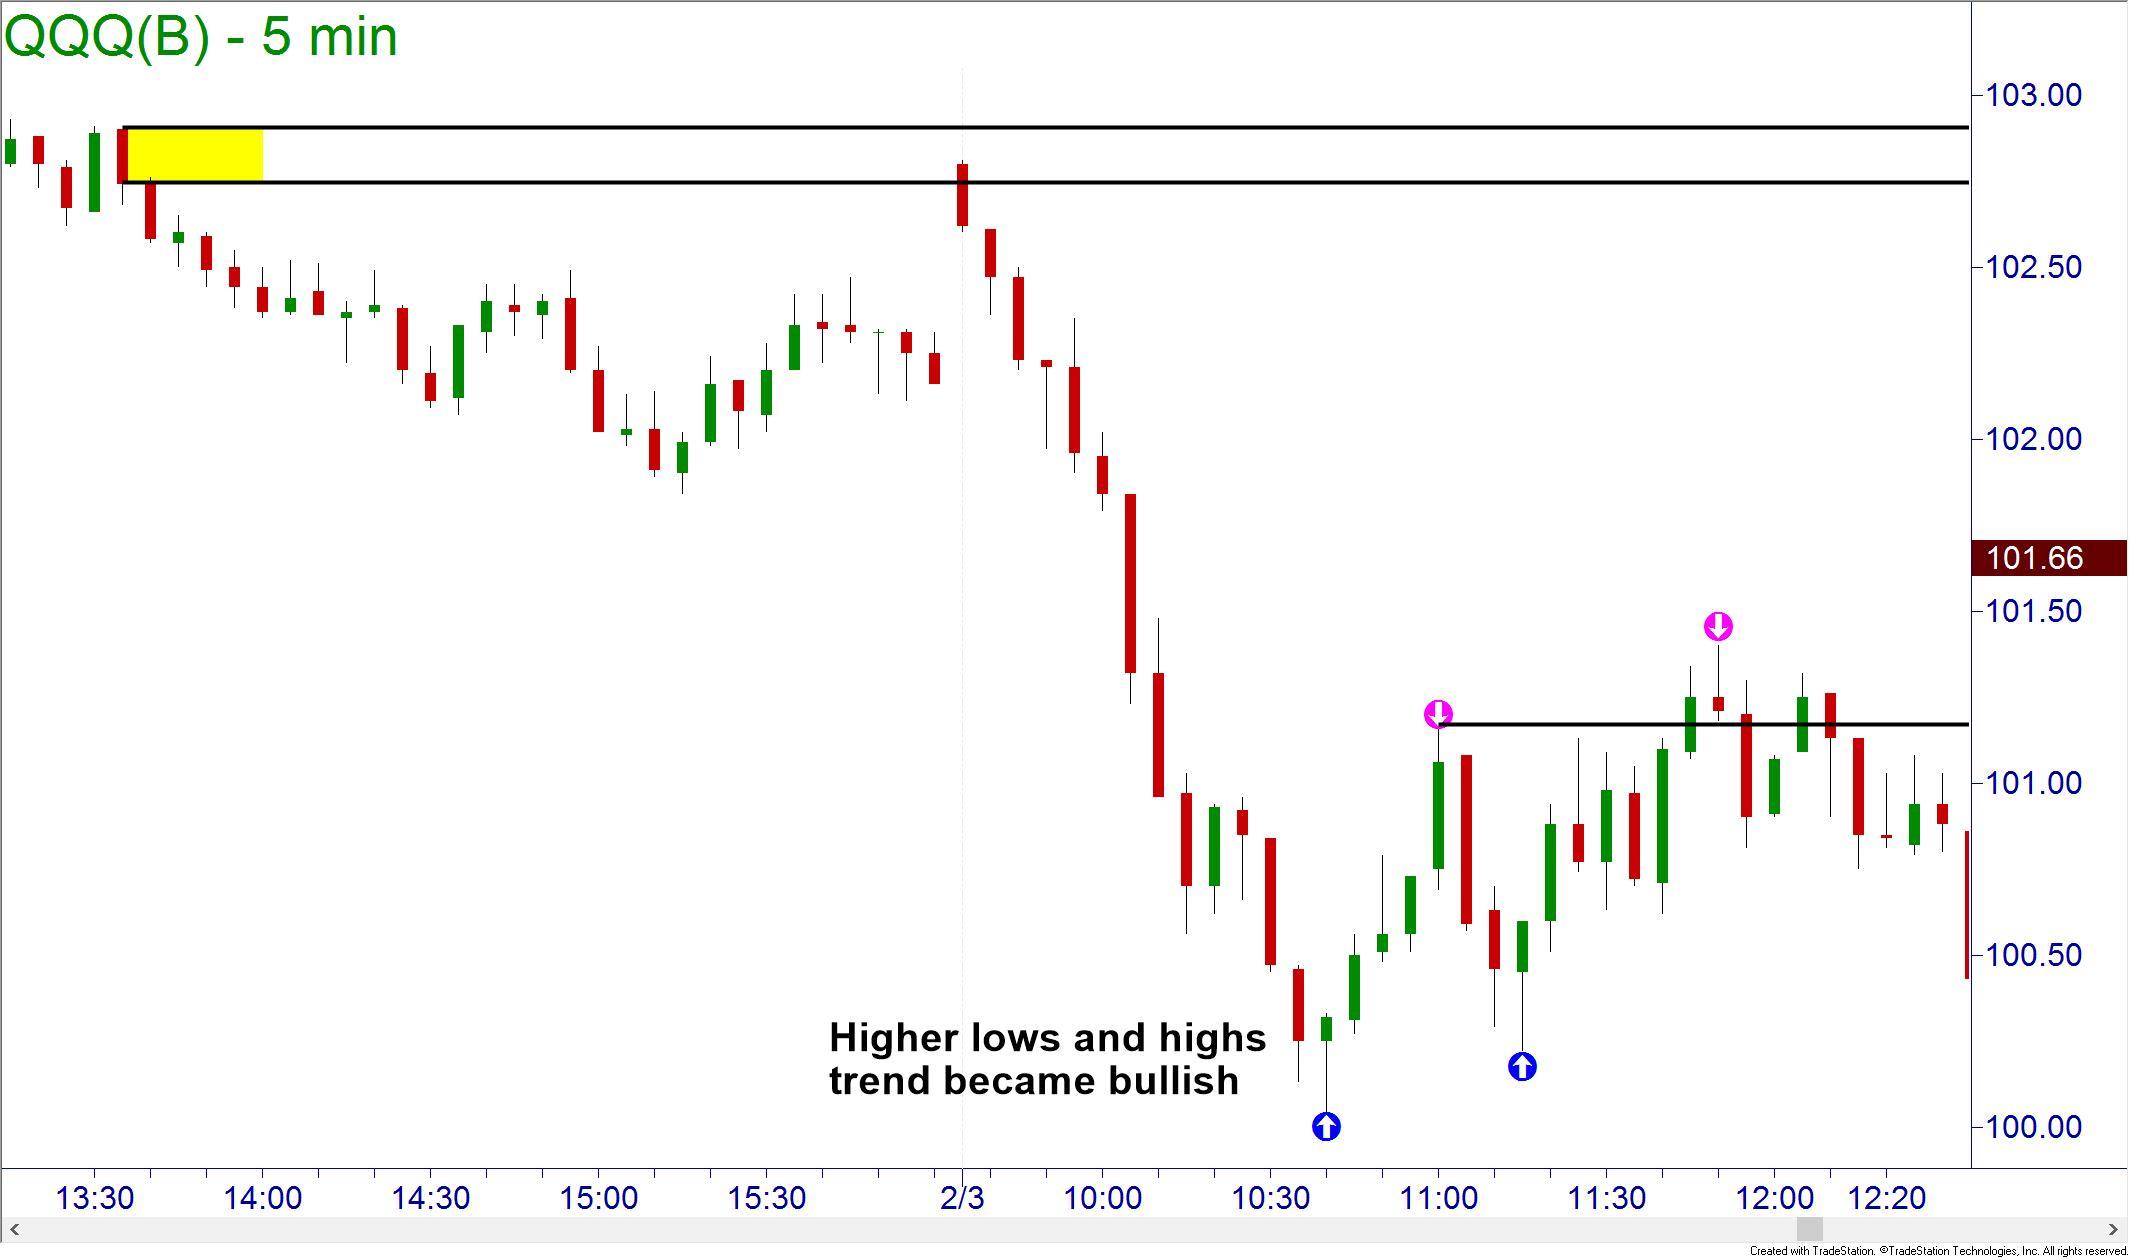
Looking at the chart of the Qs, you can see that the trend was easily identified as downward as prices plummeted at the open. Price opened at a supply zone offering an opportunity to short. If you did not exit as prices started to turn upwards from $100, the higher lows and higher highs signaled a trend change that would have told you to book your remaining profits.
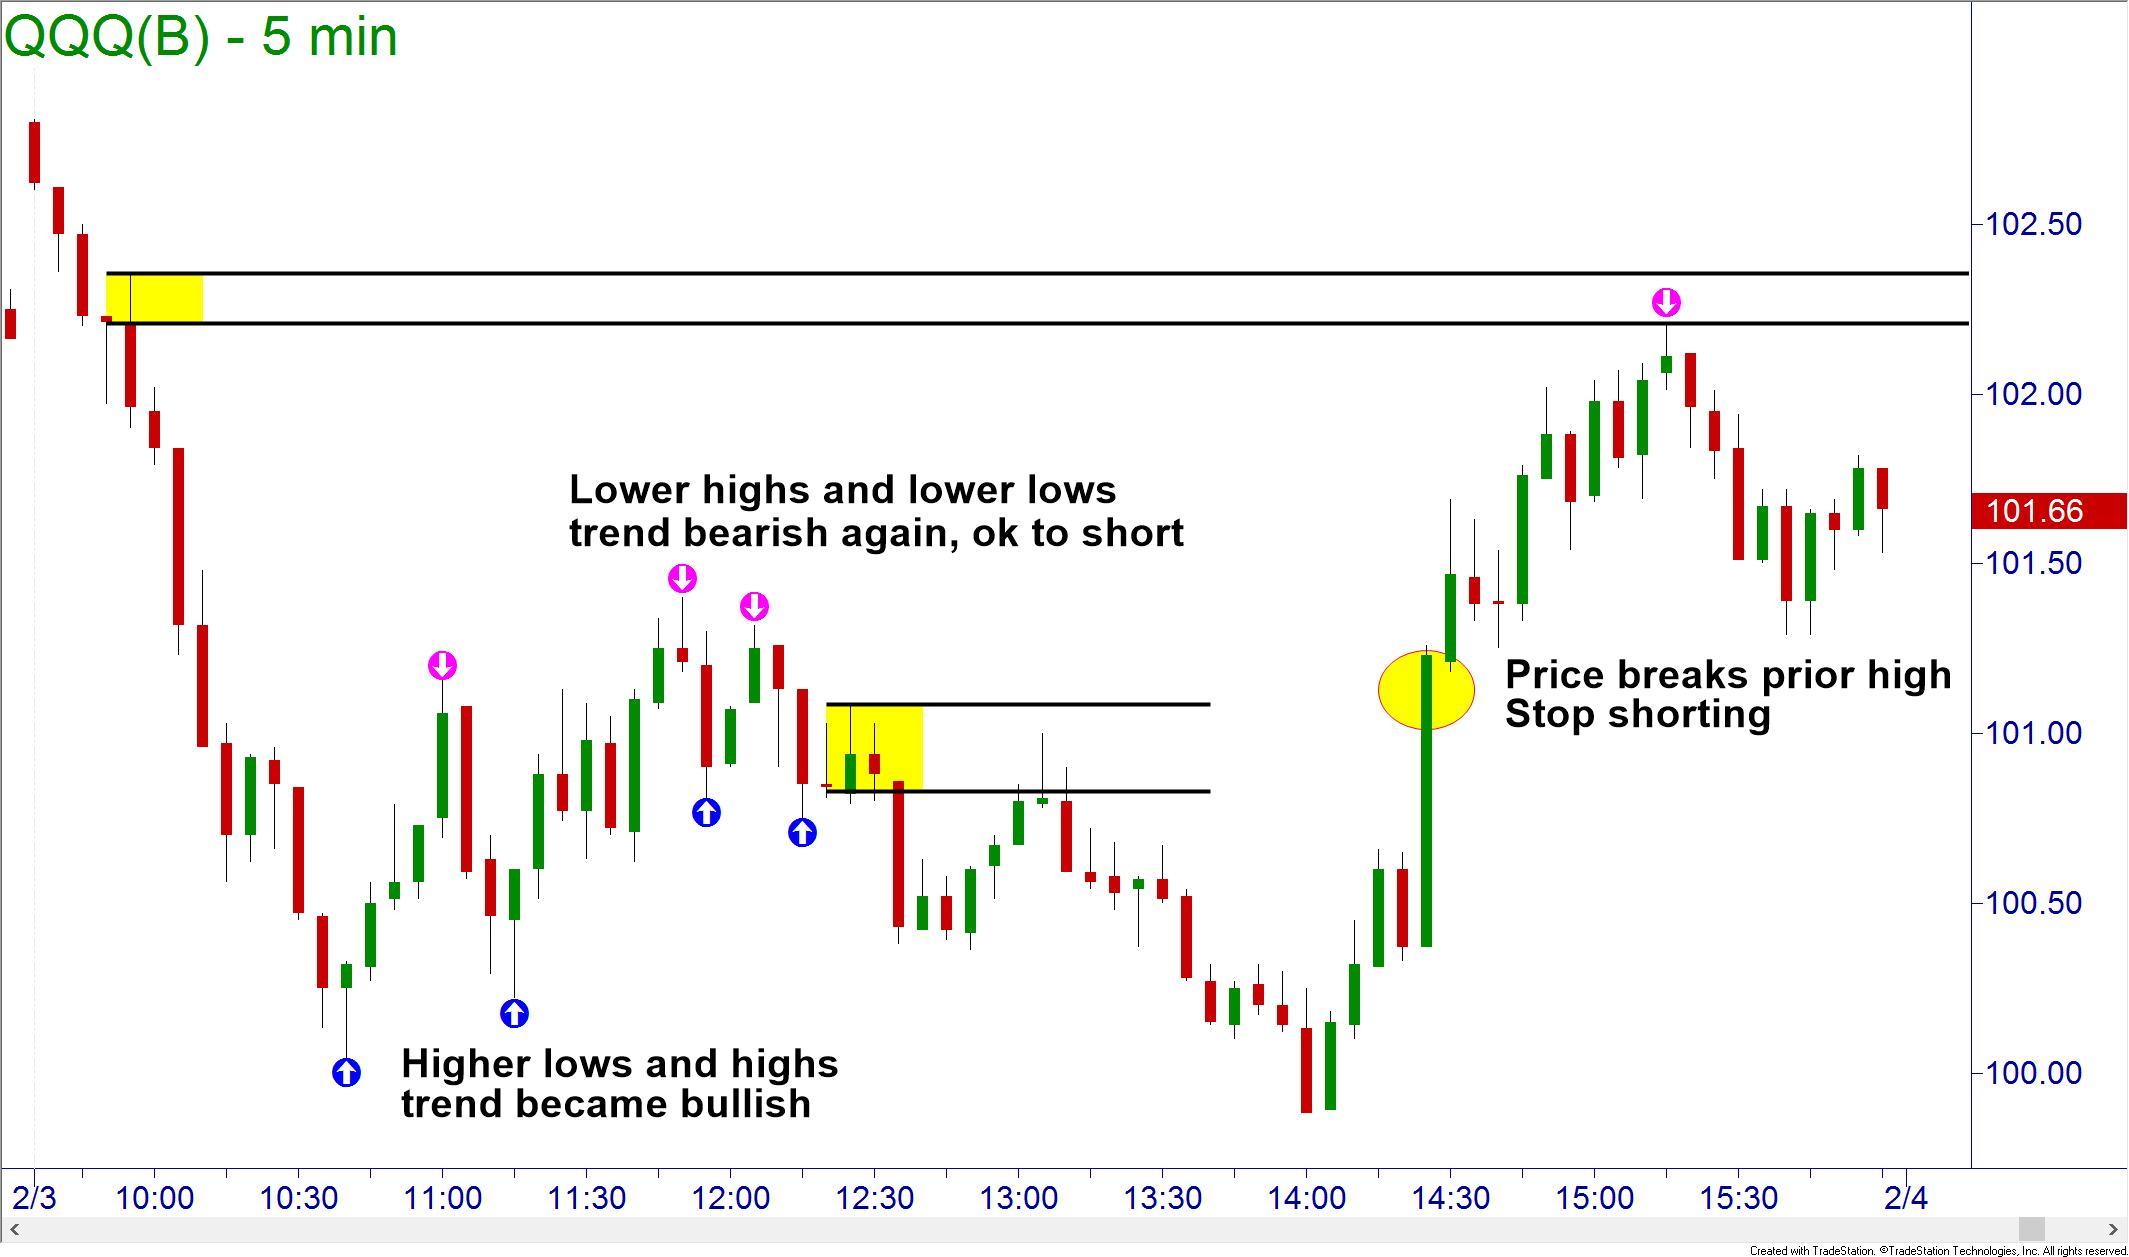
The day’s trend had changed. The introduction of higher lows and higher highs changed the direction to bullish. Traders should not have looked to short again until the trend told them to. That trend change did become apparent later in the morning when prices made lower highs and lower lows. This made it possible for the trader to look for shorts. If you had identified this, you would have been able to short the mid-day supply zone for an additional $1.00 per share profit.
Some of you may have been worried about the larger daily trend and how it would affect the intraday trends. In our courses, we also teach the proper way to use multiple time frames in trading. Even though the daily trend may not change, the smaller time frames can experience many fluctuations throughout the day.
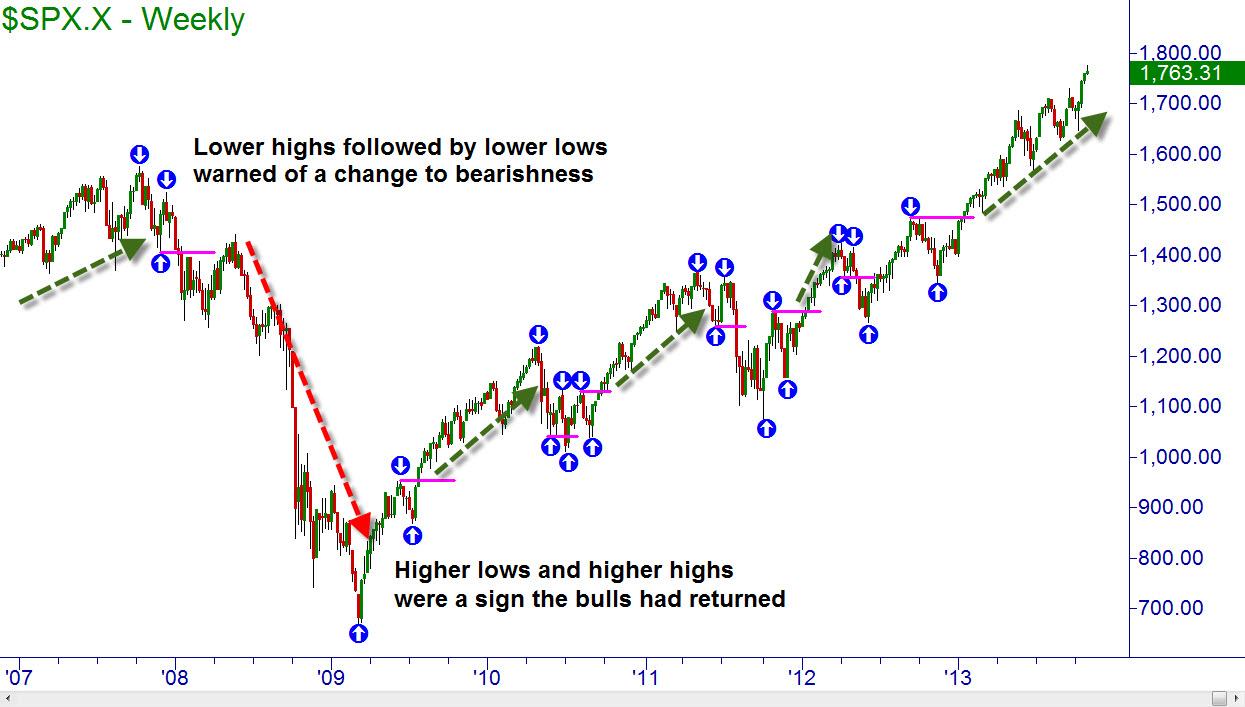
This same technique can be used on longer term trading or investing. Looking at the S&P 500 index on a weekly chart, using the definition of a trend would have helped to identify major changes in the market trends and also protected your money in times of economic downturn.
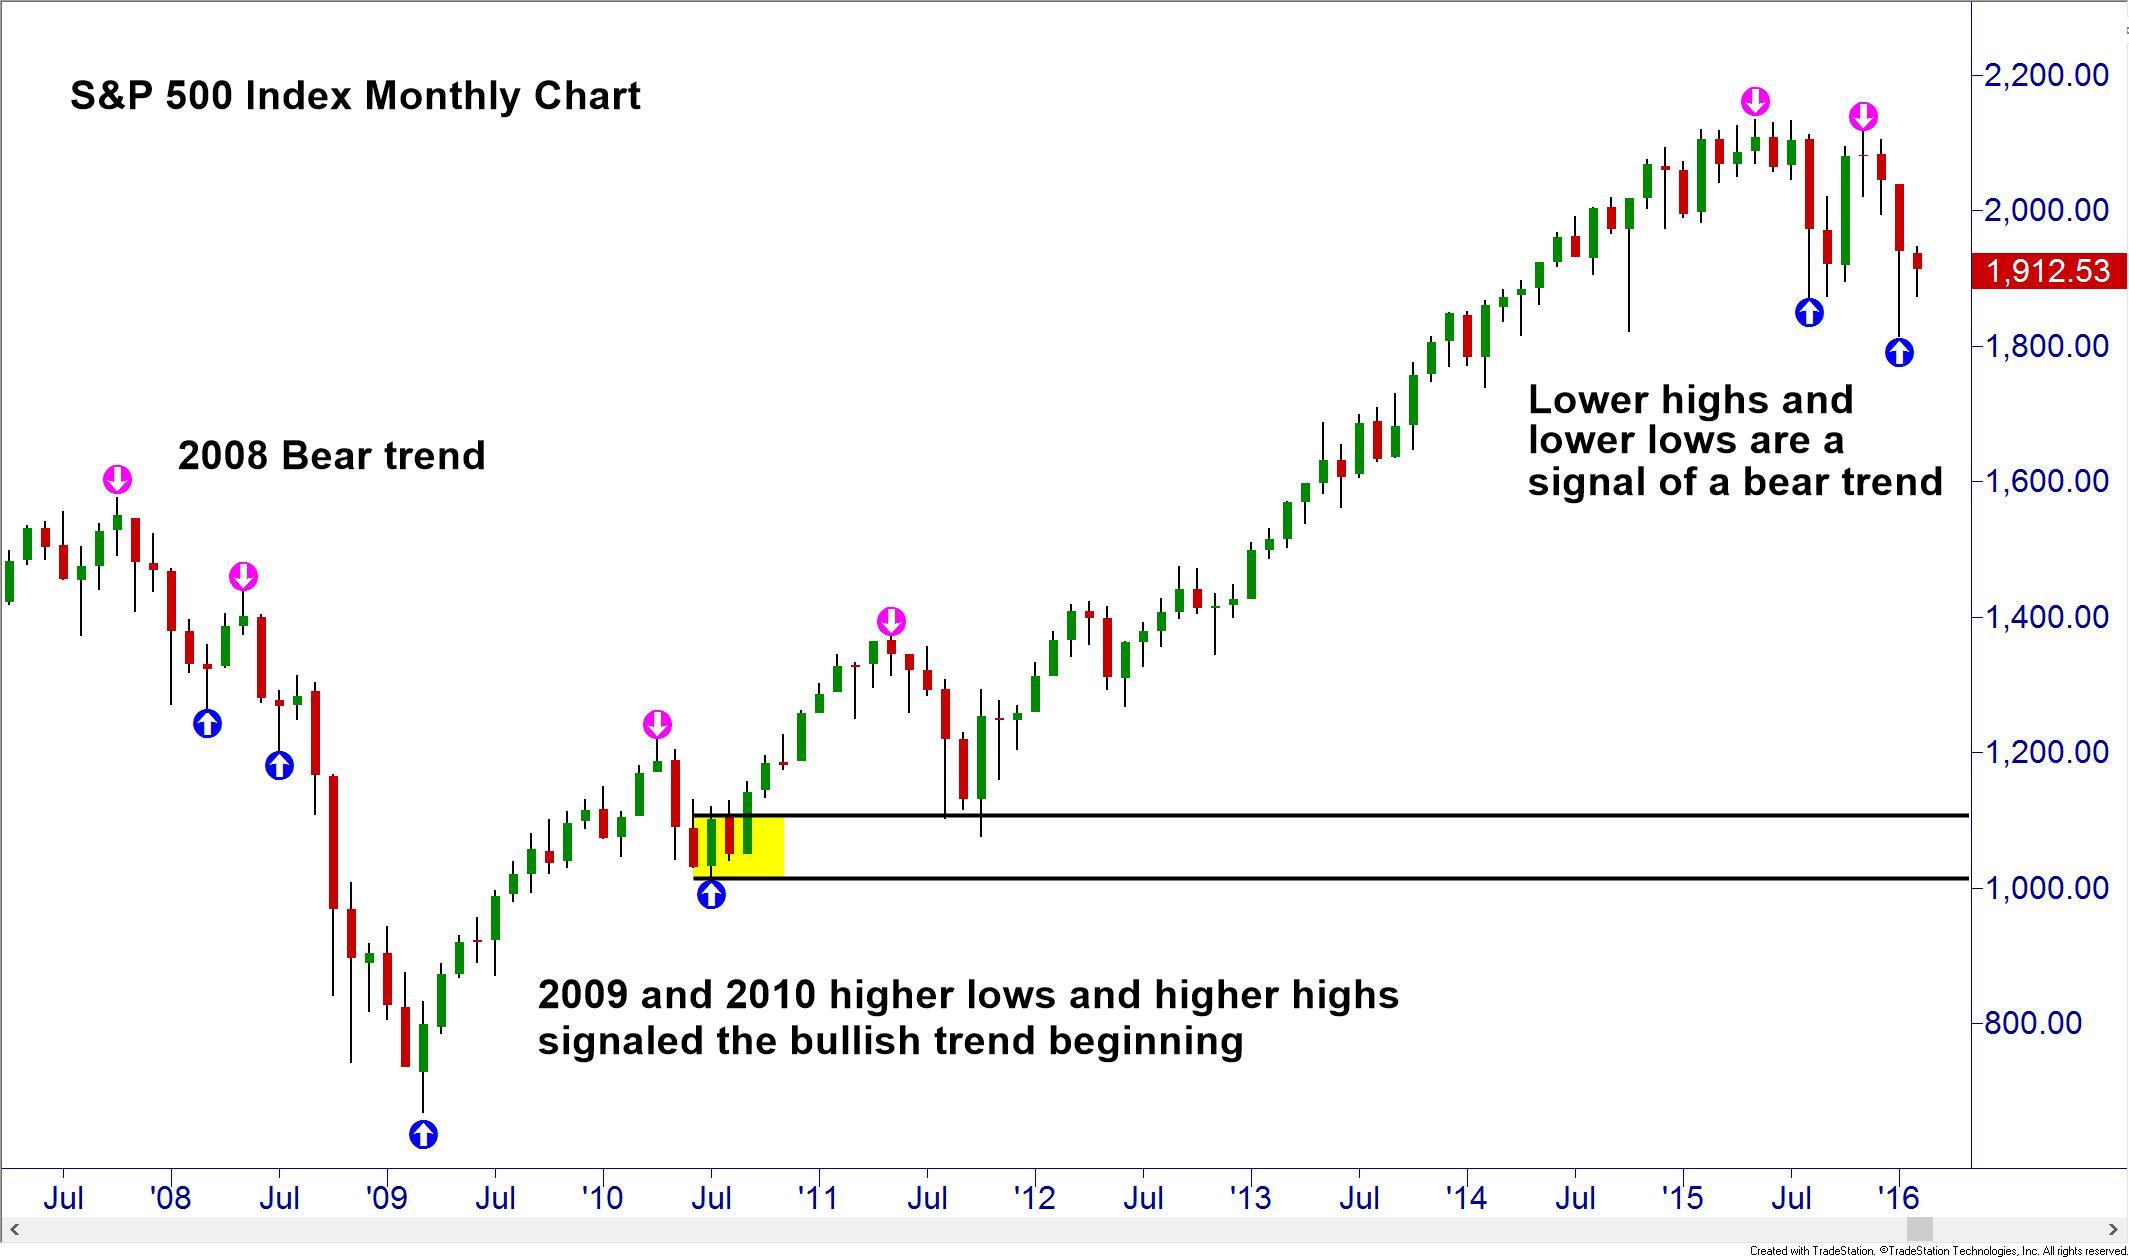
Looking at the current trend of the S&P 500 on a monthly chart, the bullish trend that began in 2009-2010 has not only appeared to have ended, but the lower highs and lower lows suggest a new bear trend beginning. This has not occurred since the market crash in 2008.
Trend trading like this will not allow you to enter at the extreme tops or bottoms. To do that you will have to practice at identifying supply and demand zones in conjunction with multiple time frame analysis. To learn more about this, come take one of our courses at Online Trading Academy.
Information on these pages contains forward-looking statements that involve risks and uncertainties. Markets and instruments profiled on this page are for informational purposes only and should not in any way come across as a recommendation to buy or sell in these assets. You should do your own thorough research before making any investment decisions. FXStreet does not in any way guarantee that this information is free from mistakes, errors, or material misstatements. It also does not guarantee that this information is of a timely nature. Investing in Open Markets involves a great deal of risk, including the loss of all or a portion of your investment, as well as emotional distress. All risks, losses and costs associated with investing, including total loss of principal, are your responsibility. The views and opinions expressed in this article are those of the authors and do not necessarily reflect the official policy or position of FXStreet nor its advertisers.