Looking Forward in the Markets
|The first week of trading in 2016 has been a crazy ride. The financial news that keeps coming out of China as well as the North Koreans working to become a nuclear power has frightened many traders and investors. Many have been left scratching their heads wondering what to do. Let’s examine the charts to see what they are saying about potential price movement in 2016.
Back in September and November of last year, I appeared on CNBC World to discuss the markets. They specifically asked me about the S&P 500, oil, gold and the US Dollar’s reaction to rate hikes and other actions from the Federal Reserve.
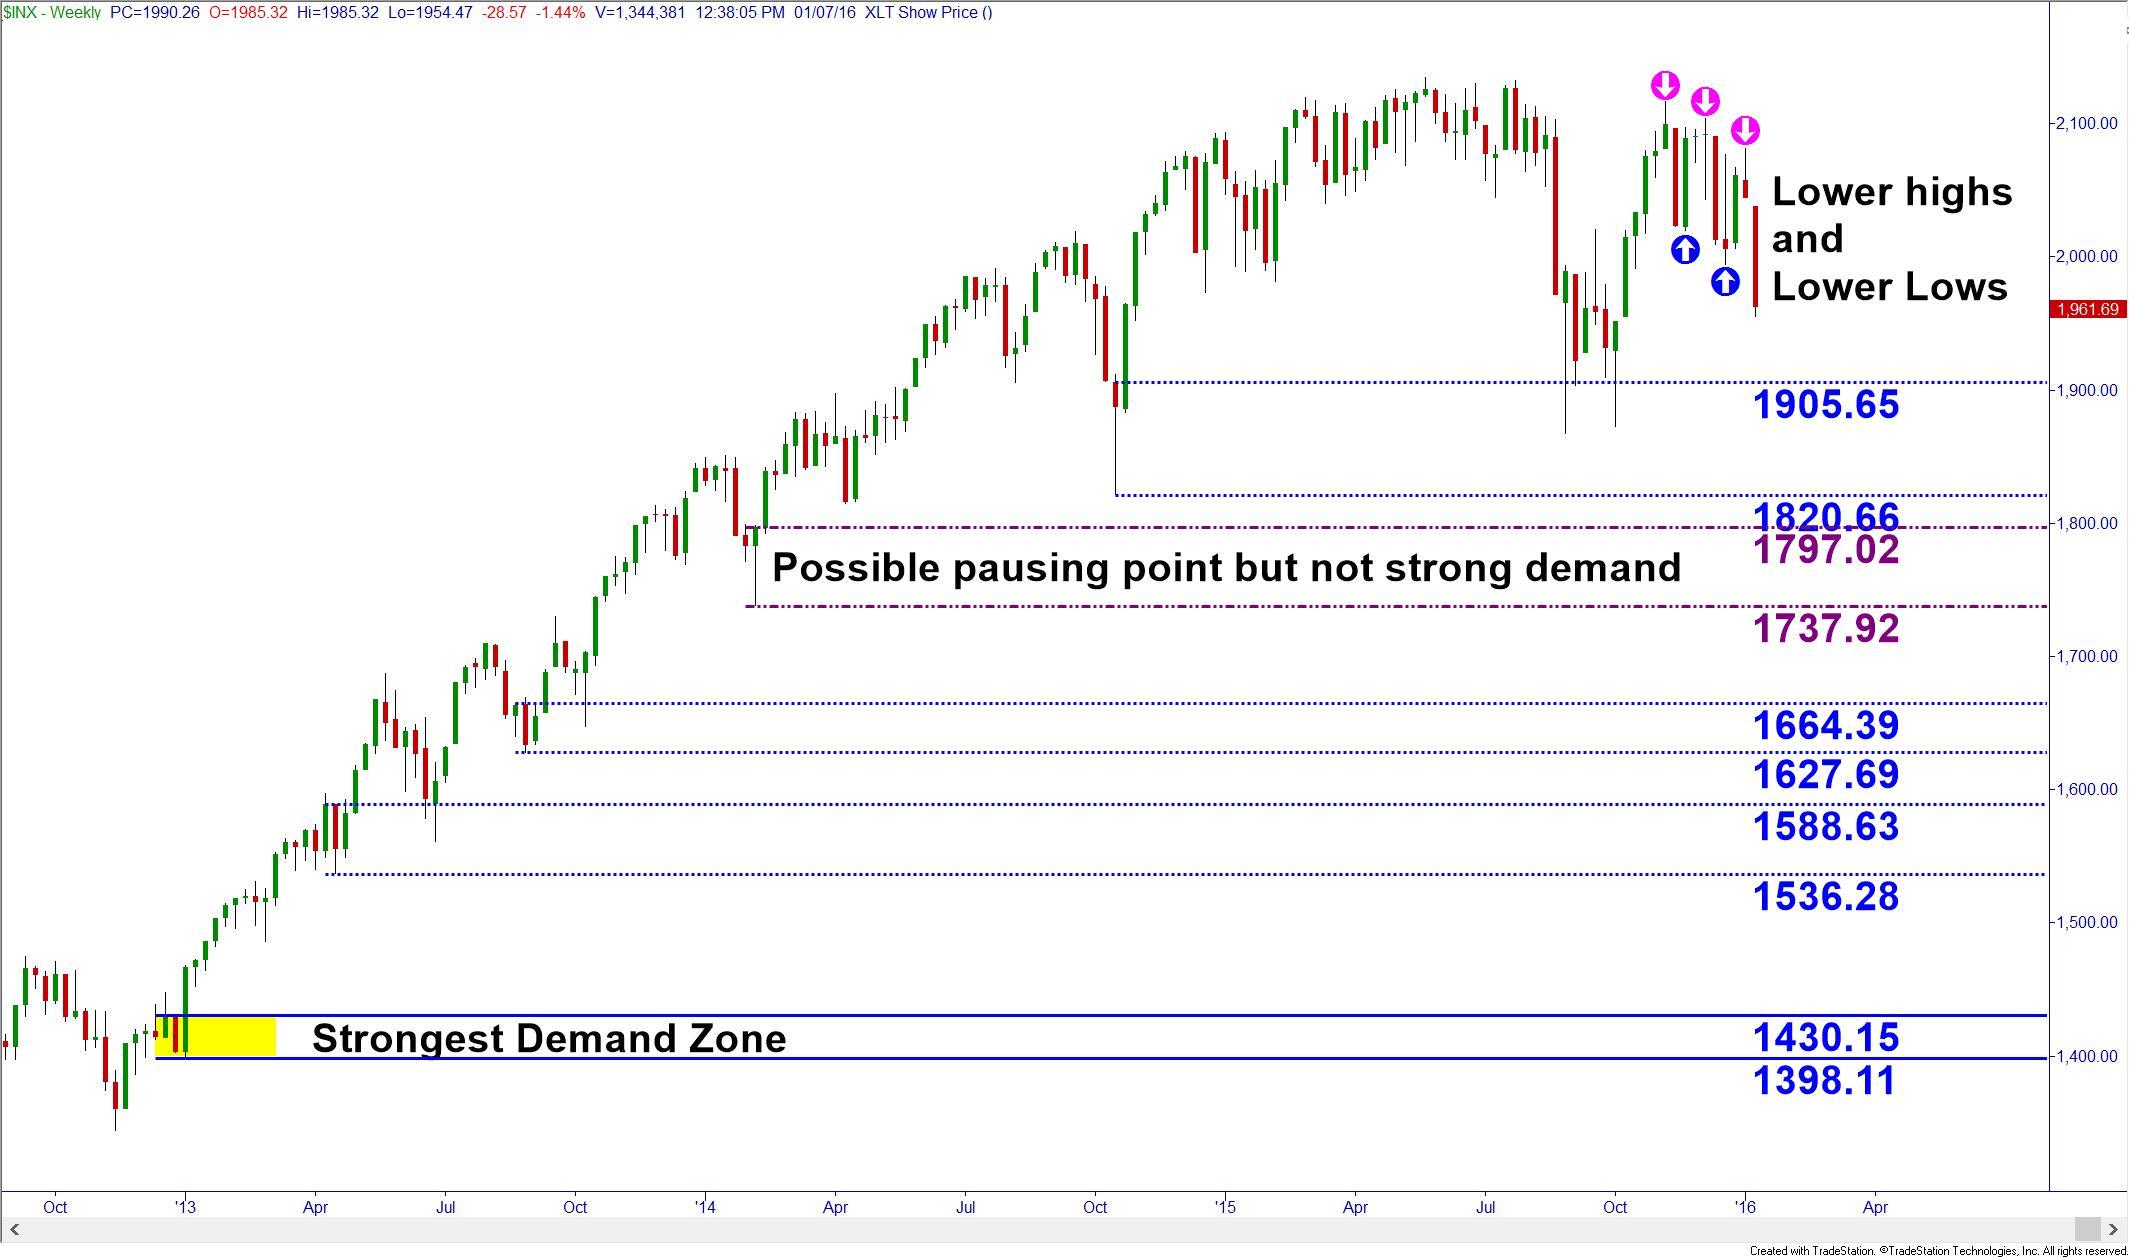
I was bearish on both appearances when it came to the US and even global equity markets and continue to hold that opinion based on my analysis. On a weekly chart, the S&P 500 Index still has not made new highs. In fact, it held the 2096.56 – 2116.48 supply zone I called on TV just two weeks after my appearance, and has now made lower highs and lower lows which are indicative of a bearish trend!
When looking at the weekly chart, the blue dotted lines are old, tested demand zones and are not likely to cause a reversal of price, only small bounces to allow investors and traders to re-engage the downtrend. The 1740-1800 level will likely mark a large bounce in prices but not a reversal in trend. This will be similar to the bounces we experienced in the spring of 2001 and also 2008 that gave investors false hope that the bear markets were finished.
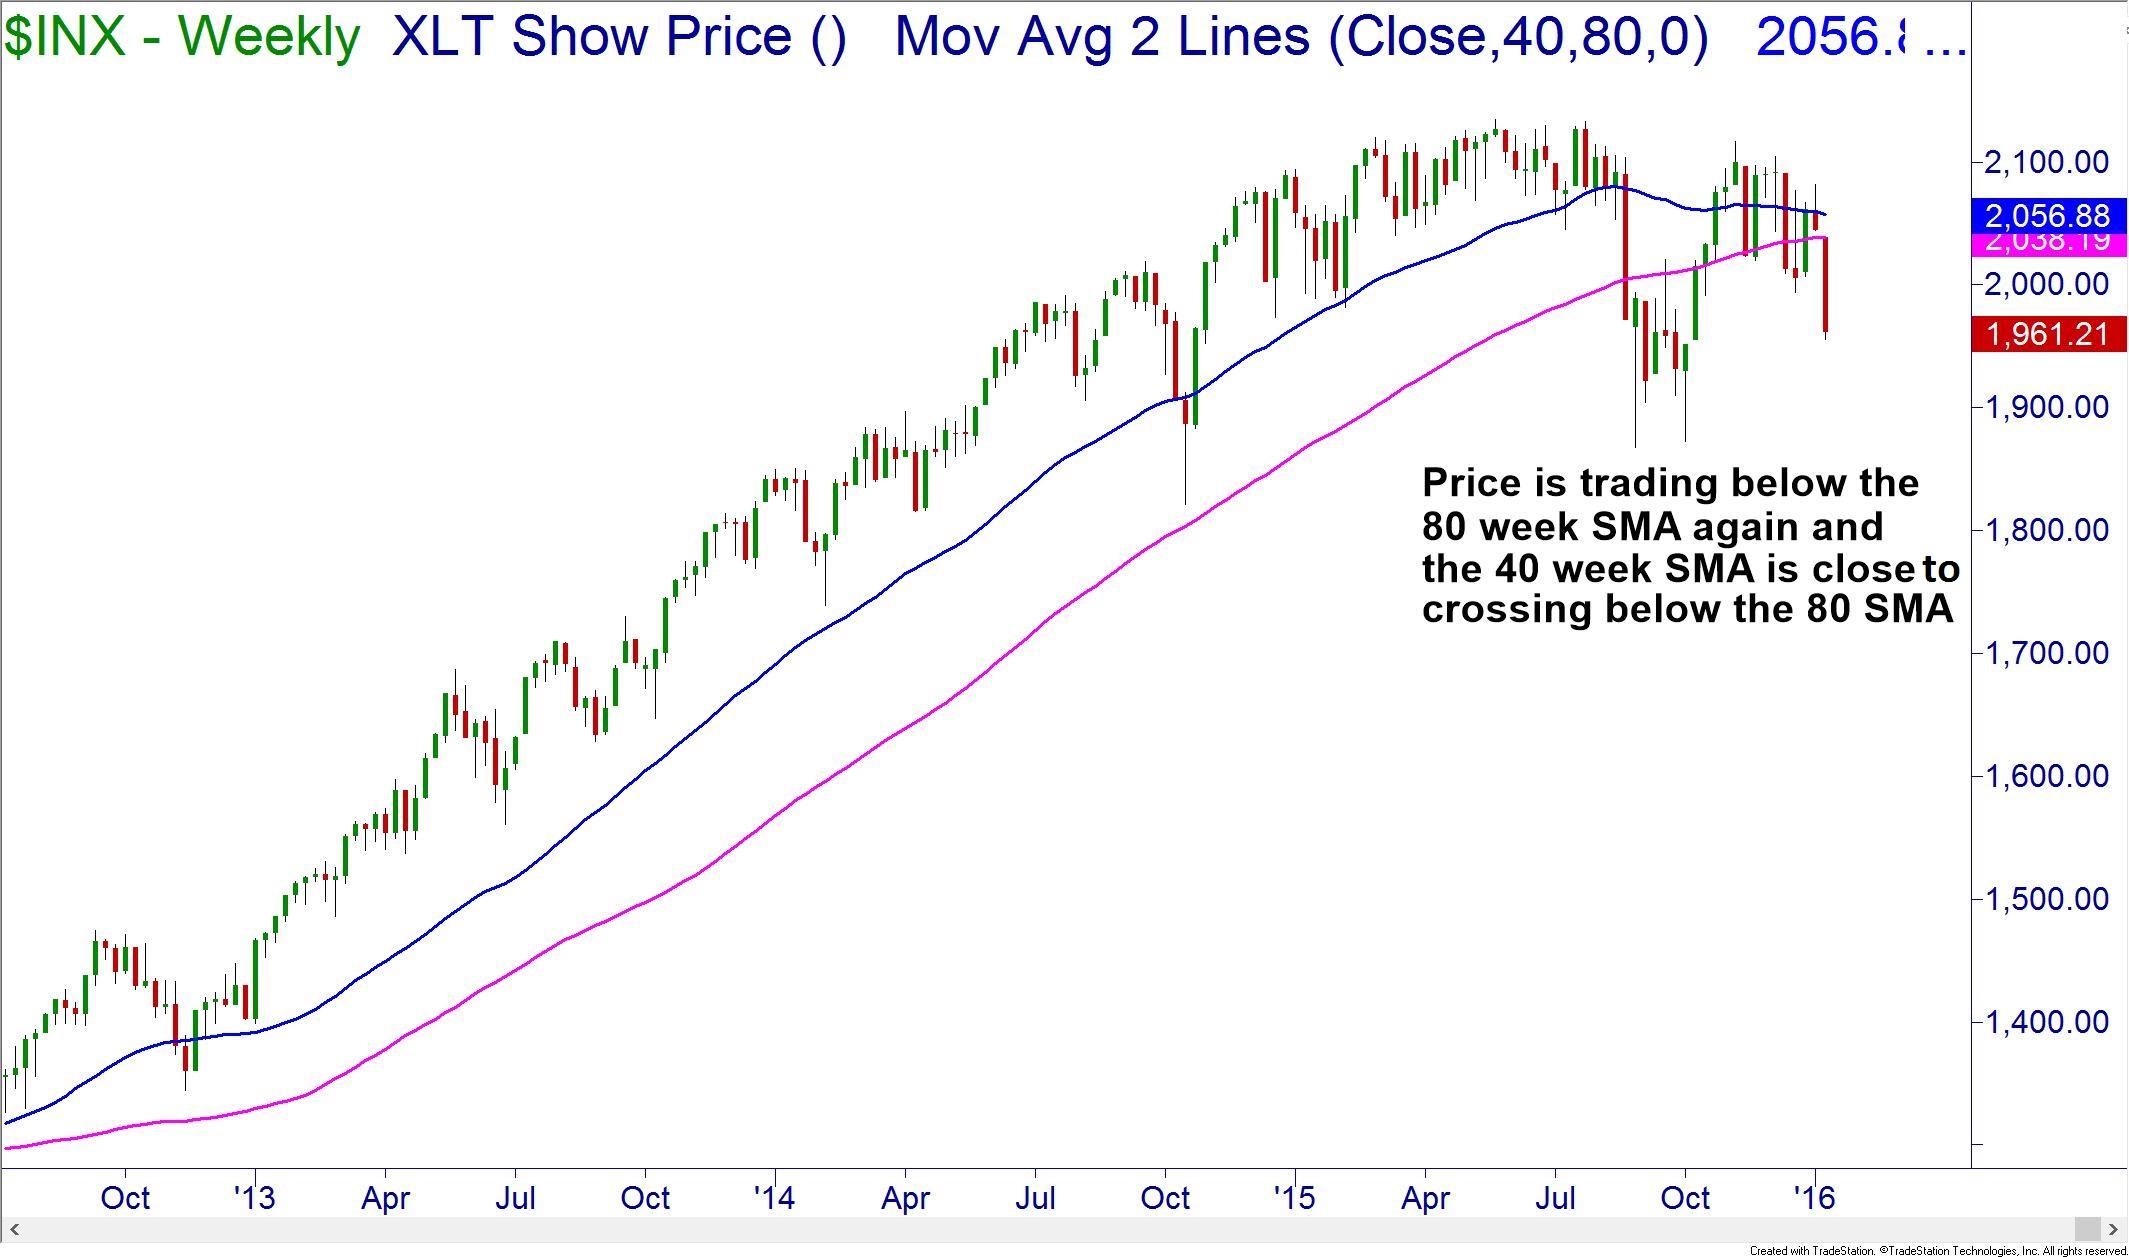
In previous articles I’ve mentioned the use of the 40 and 80 week simple moving averages as an indicator of the bull or bear market. As of the writing of this article, the index is yet again below the 80 week SMA. This time though, the 40 week SMA is very close to crossing below the 80 week SMA which is a death knell to the bull market and signals the start of the bears.
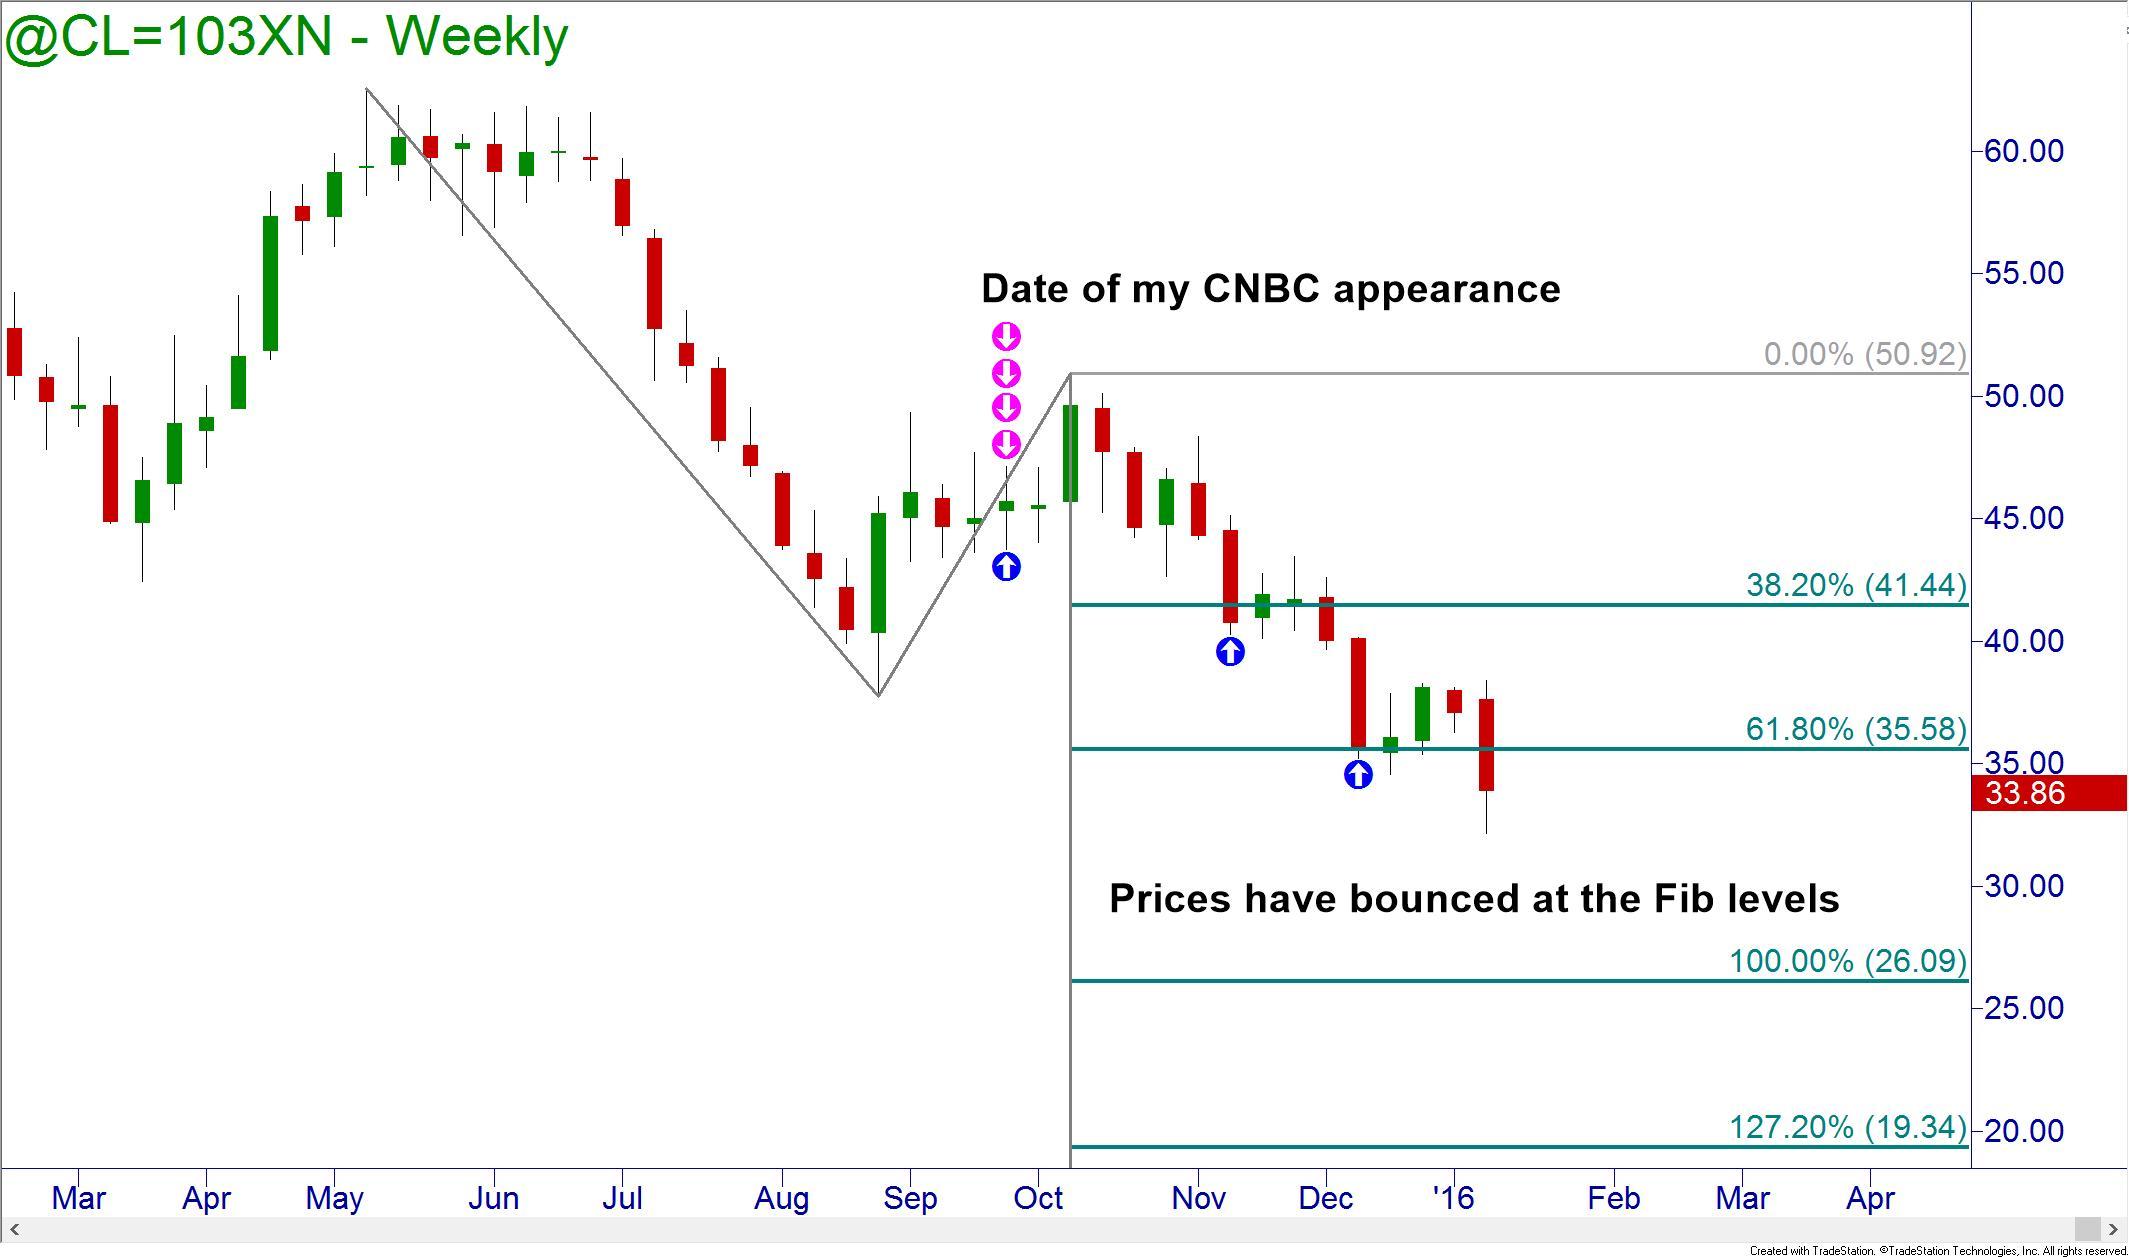
When I claimed a downside target of $27 a barrel for crude oil on CNBC on September 19th, 2015, the announcers thought they had misheard me and asked again. I also offered a short term bounce price level at $36.30. There are no prior demand zones to view on the charts to offer price targets on the downside so I applied Fibonacci Extensions to the prior impulse to arrive at the targets. Since my prediction, I have had to slightly adjust the targets since the retracement was a little different. You can see on the chart, price bounced at a couple of the extension levels already and is headed toward the revised target of $26.
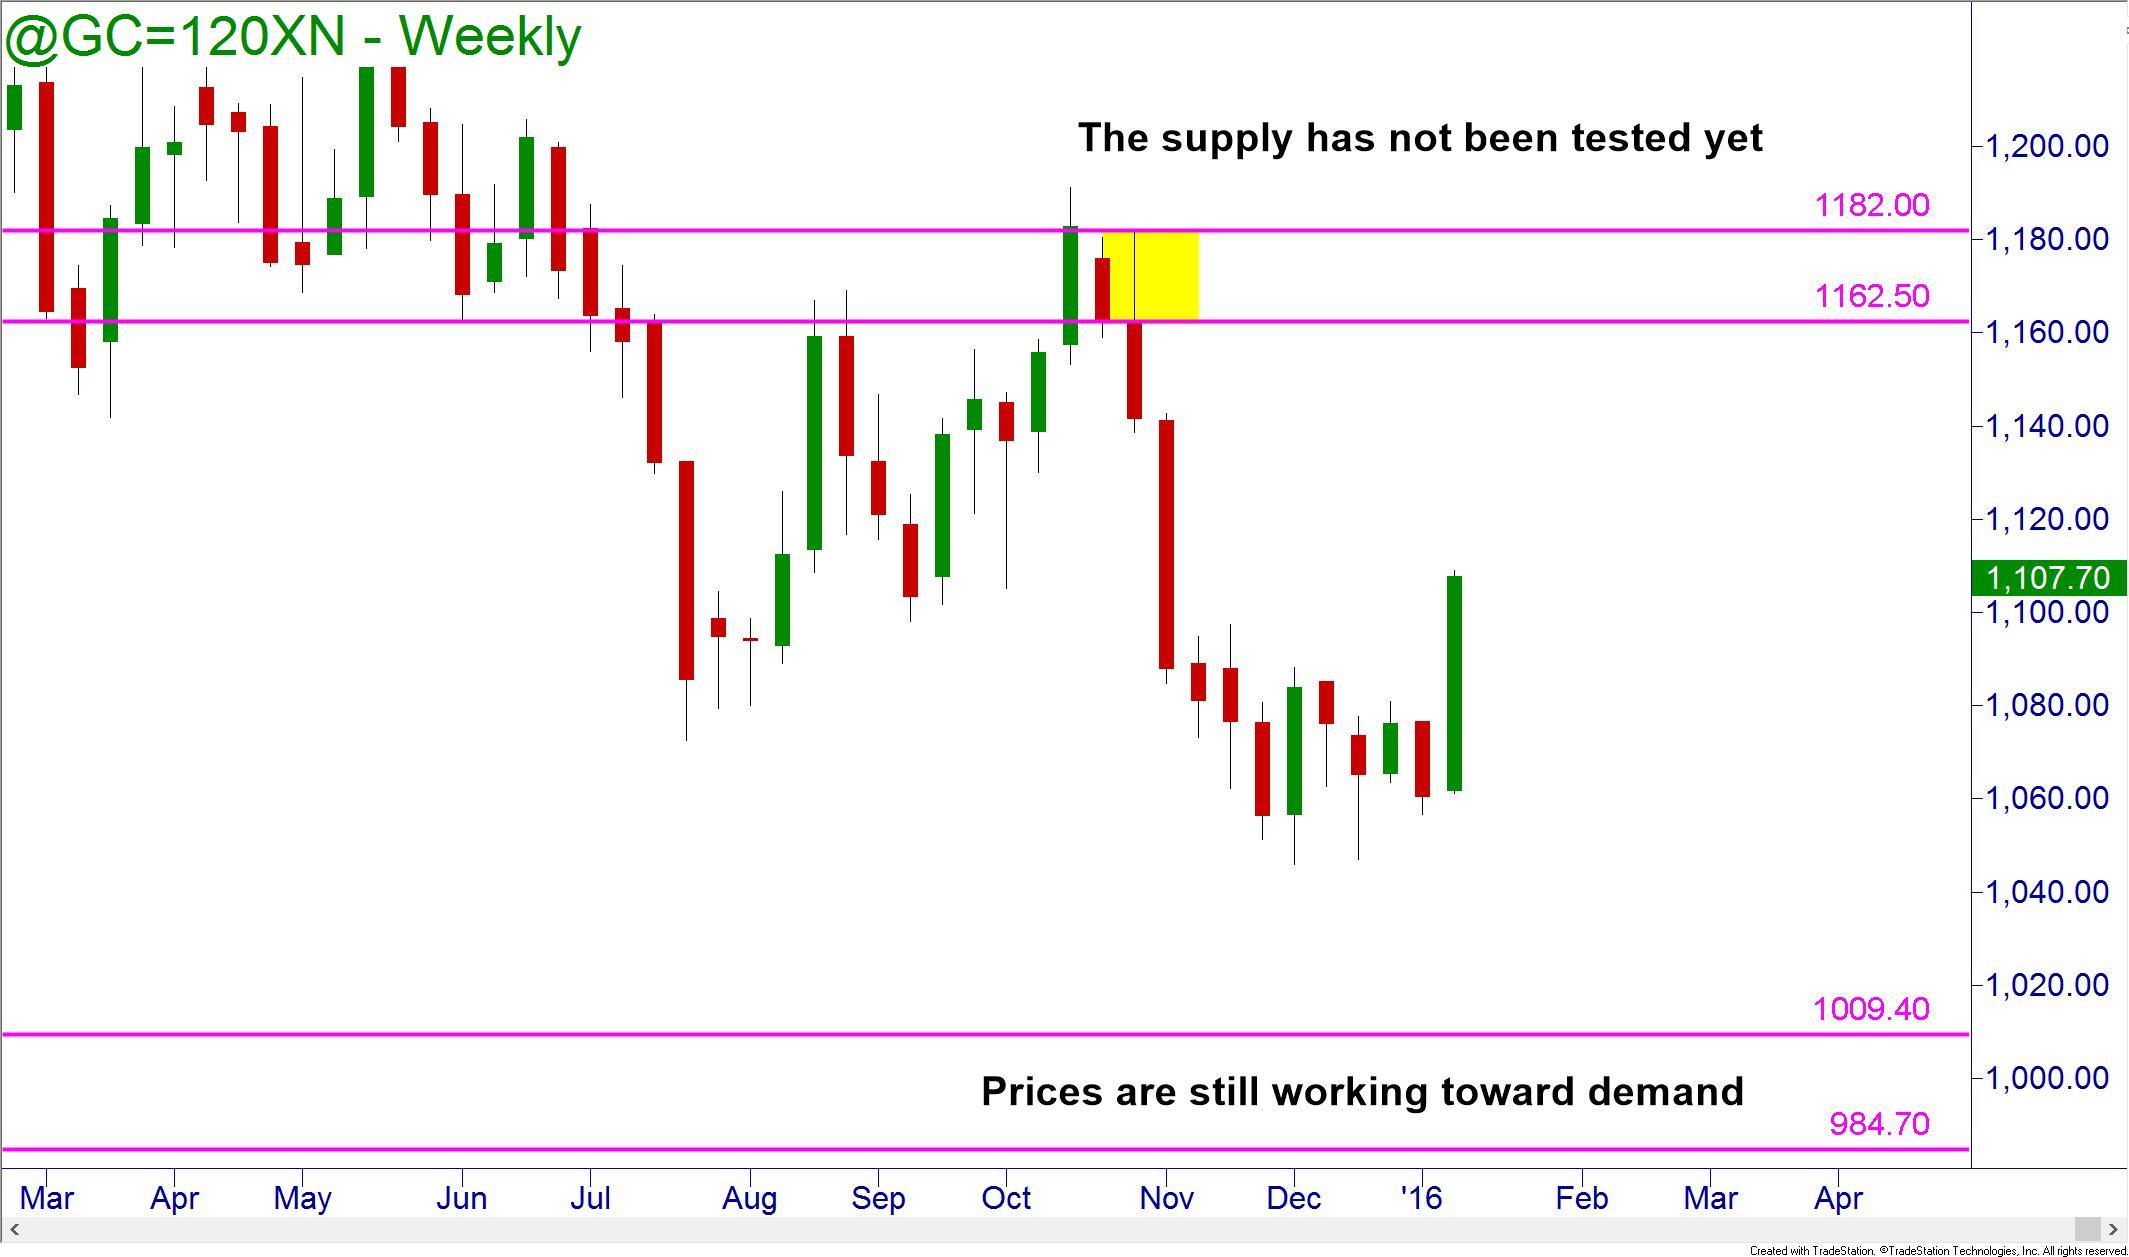
Gold is still trading between the long term supply and demand I had stated and I still expect prices to test that 1009 demand zone with sharp moves due to flight to safety trades.
Not much has changed with the US Dollar in 2015 or 2016. The Dollar futures have been stuck in a range between 93 and 100 and are still there. Should it break out upwards, there is supply at 104.50 to 107.25 before it should stop.
There are definitely opportunities in volatile markets. But there are also increased risks. Do not try to navigate these dangerous waters without having the right education and support like the type you can receive at Online Trading Academy. Come visit your local office today.
Information on these pages contains forward-looking statements that involve risks and uncertainties. Markets and instruments profiled on this page are for informational purposes only and should not in any way come across as a recommendation to buy or sell in these assets. You should do your own thorough research before making any investment decisions. FXStreet does not in any way guarantee that this information is free from mistakes, errors, or material misstatements. It also does not guarantee that this information is of a timely nature. Investing in Open Markets involves a great deal of risk, including the loss of all or a portion of your investment, as well as emotional distress. All risks, losses and costs associated with investing, including total loss of principal, are your responsibility. The views and opinions expressed in this article are those of the authors and do not necessarily reflect the official policy or position of FXStreet nor its advertisers.