Beginning of the Bear Market?
|Wow, what a wild ride the markets have been going through. The big question on all traders’ and investors’ minds is whether or not this is the beginning of a bear market. There is no doubt that the current bull market is extremely fragile. An environment of lackluster earnings and sharp reactions to news while waiting for the Fed to cut or not cut rates has been setting everyone on edge.
Some time ago I wrote about two moving averages that can be applied to the weekly chart of the S&P 500 to indicate a potential change in trend and confirm the beginning of bull and bear markets. Let’s review the use of those indicators and apply them to the current market condition.
The 40 week simple moving average, (40 SMA) is the same as the popular 200 day moving average that is talked about in books and television. When price closes below that average, it is a sign that investors are getting nervous. It is not a signal for a bear market but is a warning. When prices close back above the 40 SMA, this is not the signal for the bull market beginning but does indicate that buyers are entering the markets again.
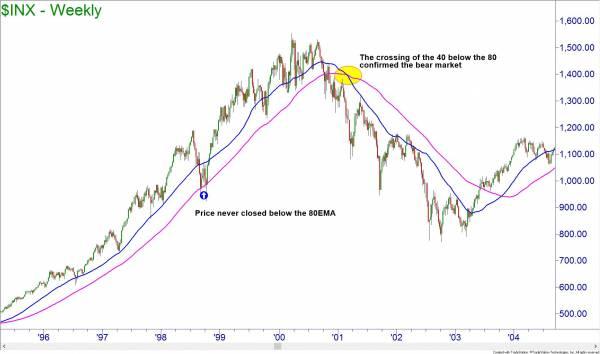
The 80 week simple moving average, (80 SMA) is more critical. The S&P 500 index does not usually close below that average unless there is a bear market looming. Looking back at the stock market’s tech bubble from 1996 to 2000, you can see that prices did not close below that average until the bear market was underway. The 40 SMA moving below the 80 SMA confirmed the bear market. During the bear market, the index used the 40 SMA as a resistance level. In mid-2003 the bulls returned and the index closed above the 80 SMA. The bull market confirmation arrived with the 40 SMA crossing above the 80 SMA later that year.
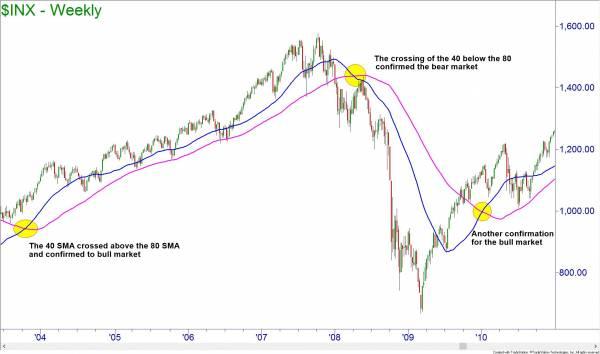
The next bull and bear market followed the same pattern. During the housing bubble of 2004 to 2008, the index never closed below the 80 SMA. There were closes below the 40 SMA but they were near the end of small corrections. In January 2008, the index did close below the 80 SMA and the bull-run came to an end.
Just as it did in 2003, the bear market ended with the S&P 500 index closing above the 80 SMA in late 2009 and the 40 SMA crossing above the 80 SMA shortly after.
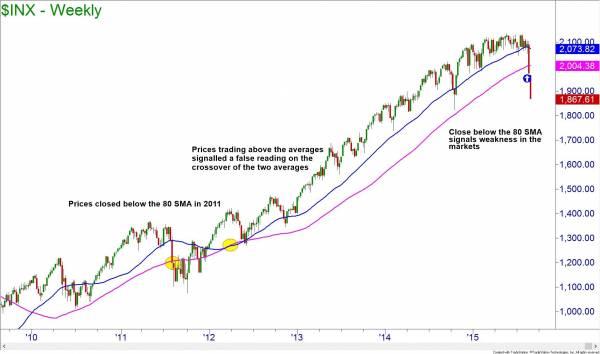
These indications from the S&P 500 index have been remarkably accurate. There was one false signal in 2011. However, the fact that the index was trading above the moving averages when they crossed it warned of a false signal.
The week ending August 21st saw the S&P 500 index closing below the 80 SMA for the first time since early 2012. This was not preceded by a close below the 40 SMA as a warning since it was such a sharp drop. The next signal to watch for will be the 40 SMA crossing below the 80 SMA. Since the price drop was so drastic, this may not happen for some time. When and if this happens, watch to see if the index is trading above the moving averages. If it is, it is likely a false signal and we are only experiencing a correction. But if the index is below the averages when they cross, the bear market is in place.
It is important to remember that this is a lagging signal and is not as reliable as being able to read price. You need to trade as the institutions do. This is the basis of Online Trading Academy’s core strategy. Come learn how to not just survive, but how to thrive in tumultuous markets by visiting your local Online Trading Academy center today.
Information on these pages contains forward-looking statements that involve risks and uncertainties. Markets and instruments profiled on this page are for informational purposes only and should not in any way come across as a recommendation to buy or sell in these assets. You should do your own thorough research before making any investment decisions. FXStreet does not in any way guarantee that this information is free from mistakes, errors, or material misstatements. It also does not guarantee that this information is of a timely nature. Investing in Open Markets involves a great deal of risk, including the loss of all or a portion of your investment, as well as emotional distress. All risks, losses and costs associated with investing, including total loss of principal, are your responsibility. The views and opinions expressed in this article are those of the authors and do not necessarily reflect the official policy or position of FXStreet nor its advertisers.