Using Relative Strength Index As An Odds Enhancer
|Students often ask me about how I use the popular Relative Strength Index (RSI) technical indicator in my trading. I want to stress that my entries and exits for trades are triggered by price action and I use the core strategy taught at Online Trading Academy in my own trading. The indicators I use are simply an odds enhancer or a support tool.
In the past I have written articles that mention the RSI will not offer you proper buying or selling signals in strong trending markets. Instead of using the indicator for entry signals, I use it more as a filter to keep me out of trades that are less likely to work.
Let me review what happens with the RSI in strong trends. Most traders are familiar with the Relative Strength Index or RSI. It is an oscillator that measures the strength of up or down moves in price relative to the stock’s previous price movements. The typical readings for this indicator are 70-30. A reading of 70% means that the stock is overbought and likely to drop soon. The RSI crossing below the 70% line is sometimes taken as a sell signal. Conversely, a reading below 30% shows the stock to be oversold and perhaps ready to rise. A buy signal is said to be generated when the RSI crosses above 30.
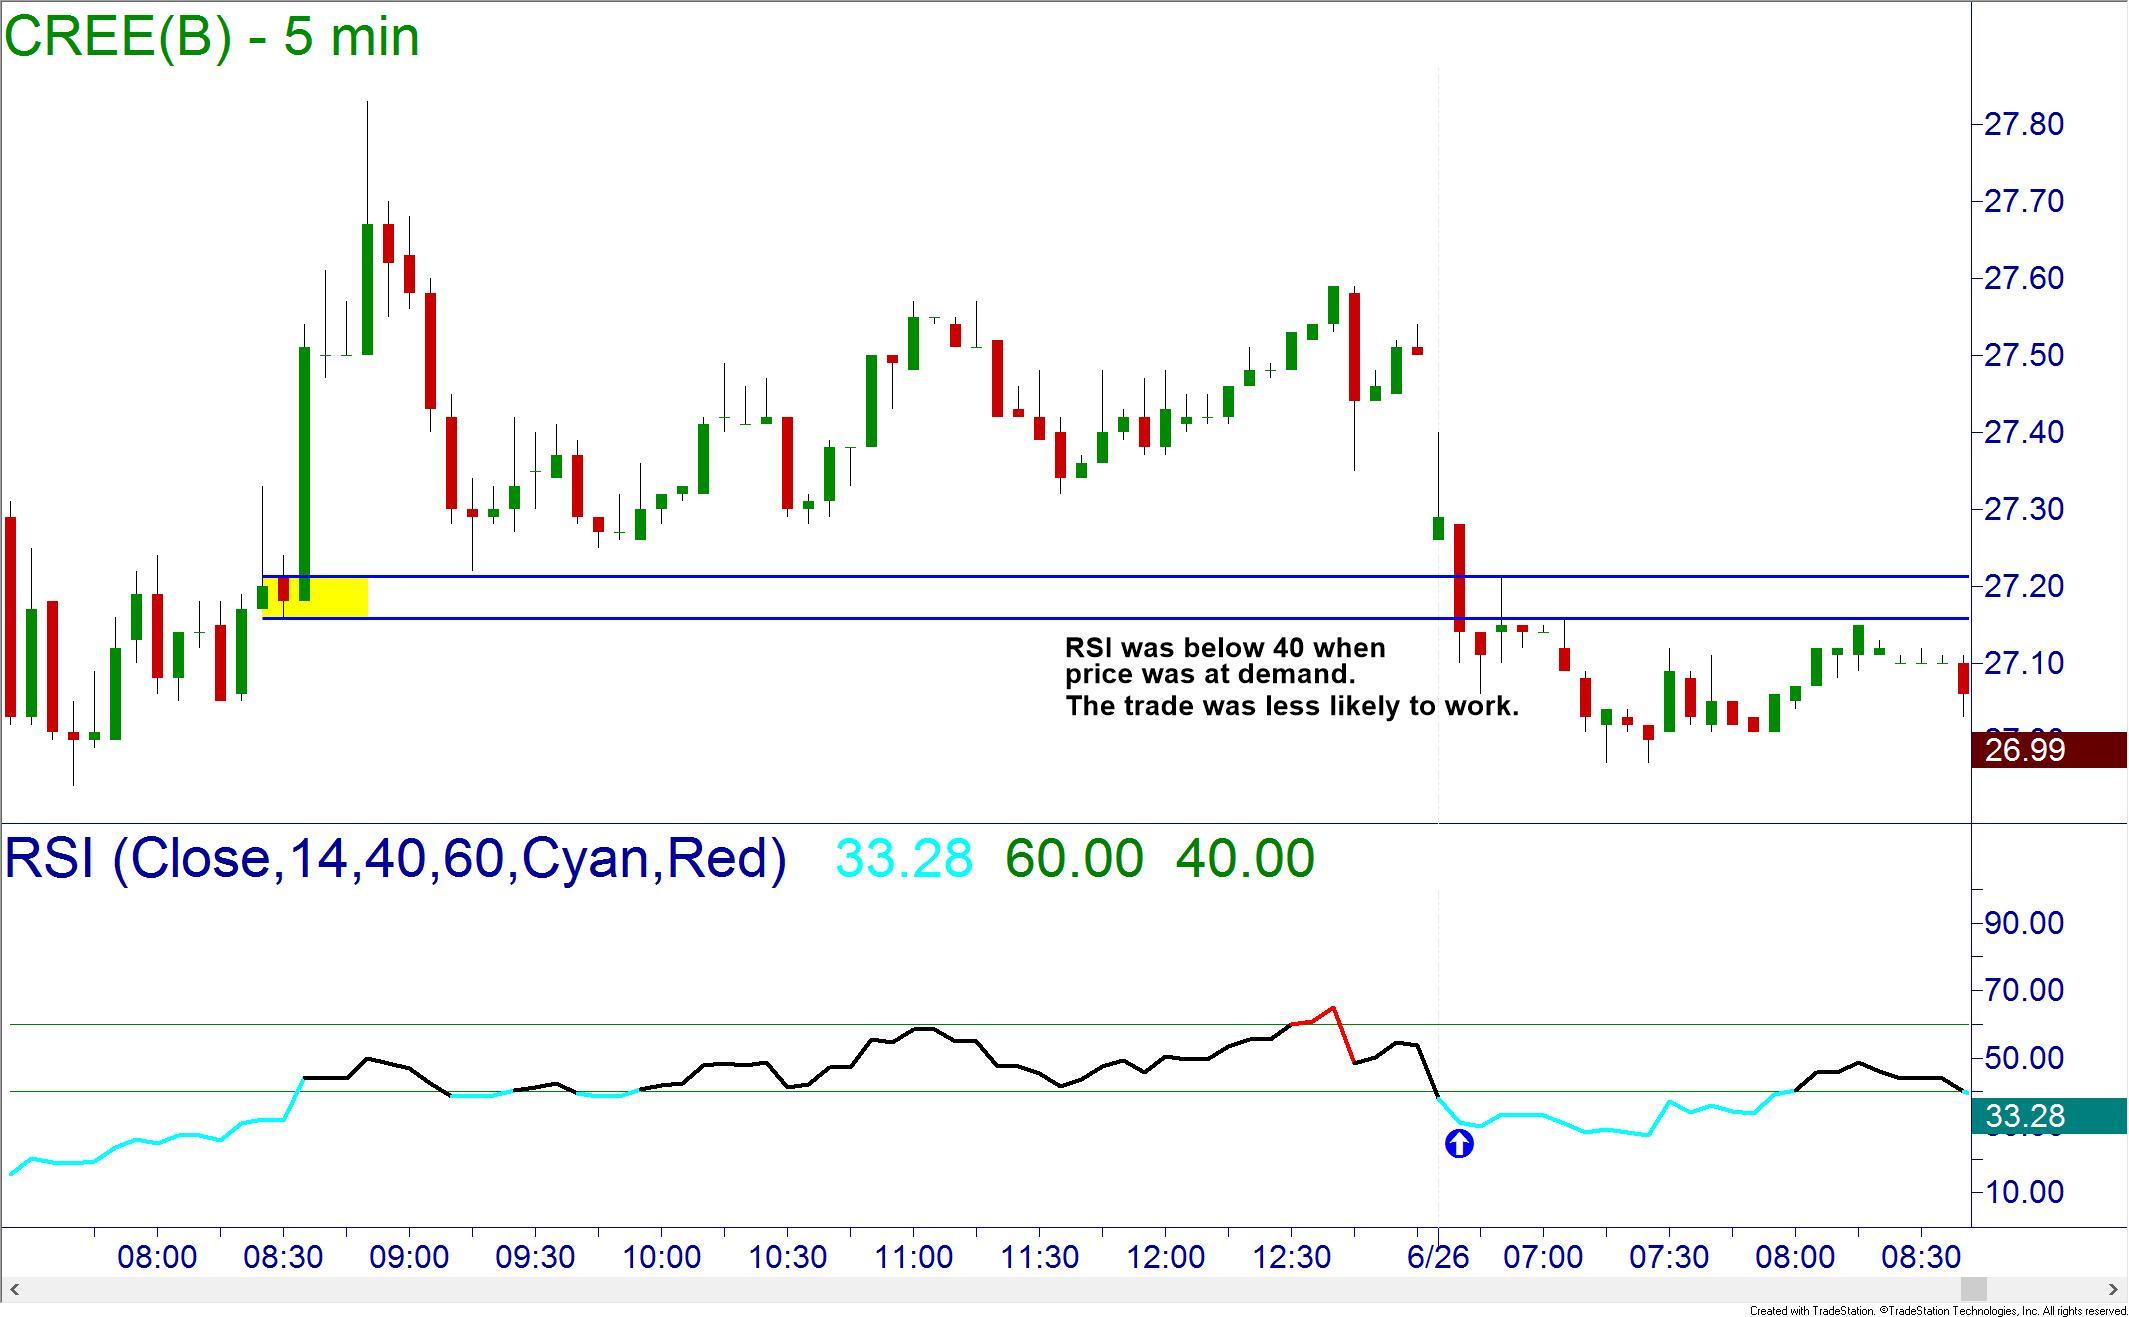
The problem with using the RSI in this manner is that in a strong uptrend the RSI will typically use 40 as a support level. When price is in a strong downtrend, the RSI will use 60 as a resistance level. When we are trading in the trend, we want to let our profits run as long as possible and do not want to enter into trades with a low probability of working. We can use the RSI with those new parameters to help us identify some of those opportunities as we approach supply and demand levels. In an uptrend for instance, we want to hold longs as supply breaks and prices move to higher levels. If we see on pullbacks that the price fails to break 40 on the RSI, then you are still in a bullish trend and are likely to break the subsequent supply level. However, if you are looking to buy during a pullback to demand and the RSI is below 40, you may want to pass on the trade or have a closer target since price it is less likely to make new highs when/if it bounces.
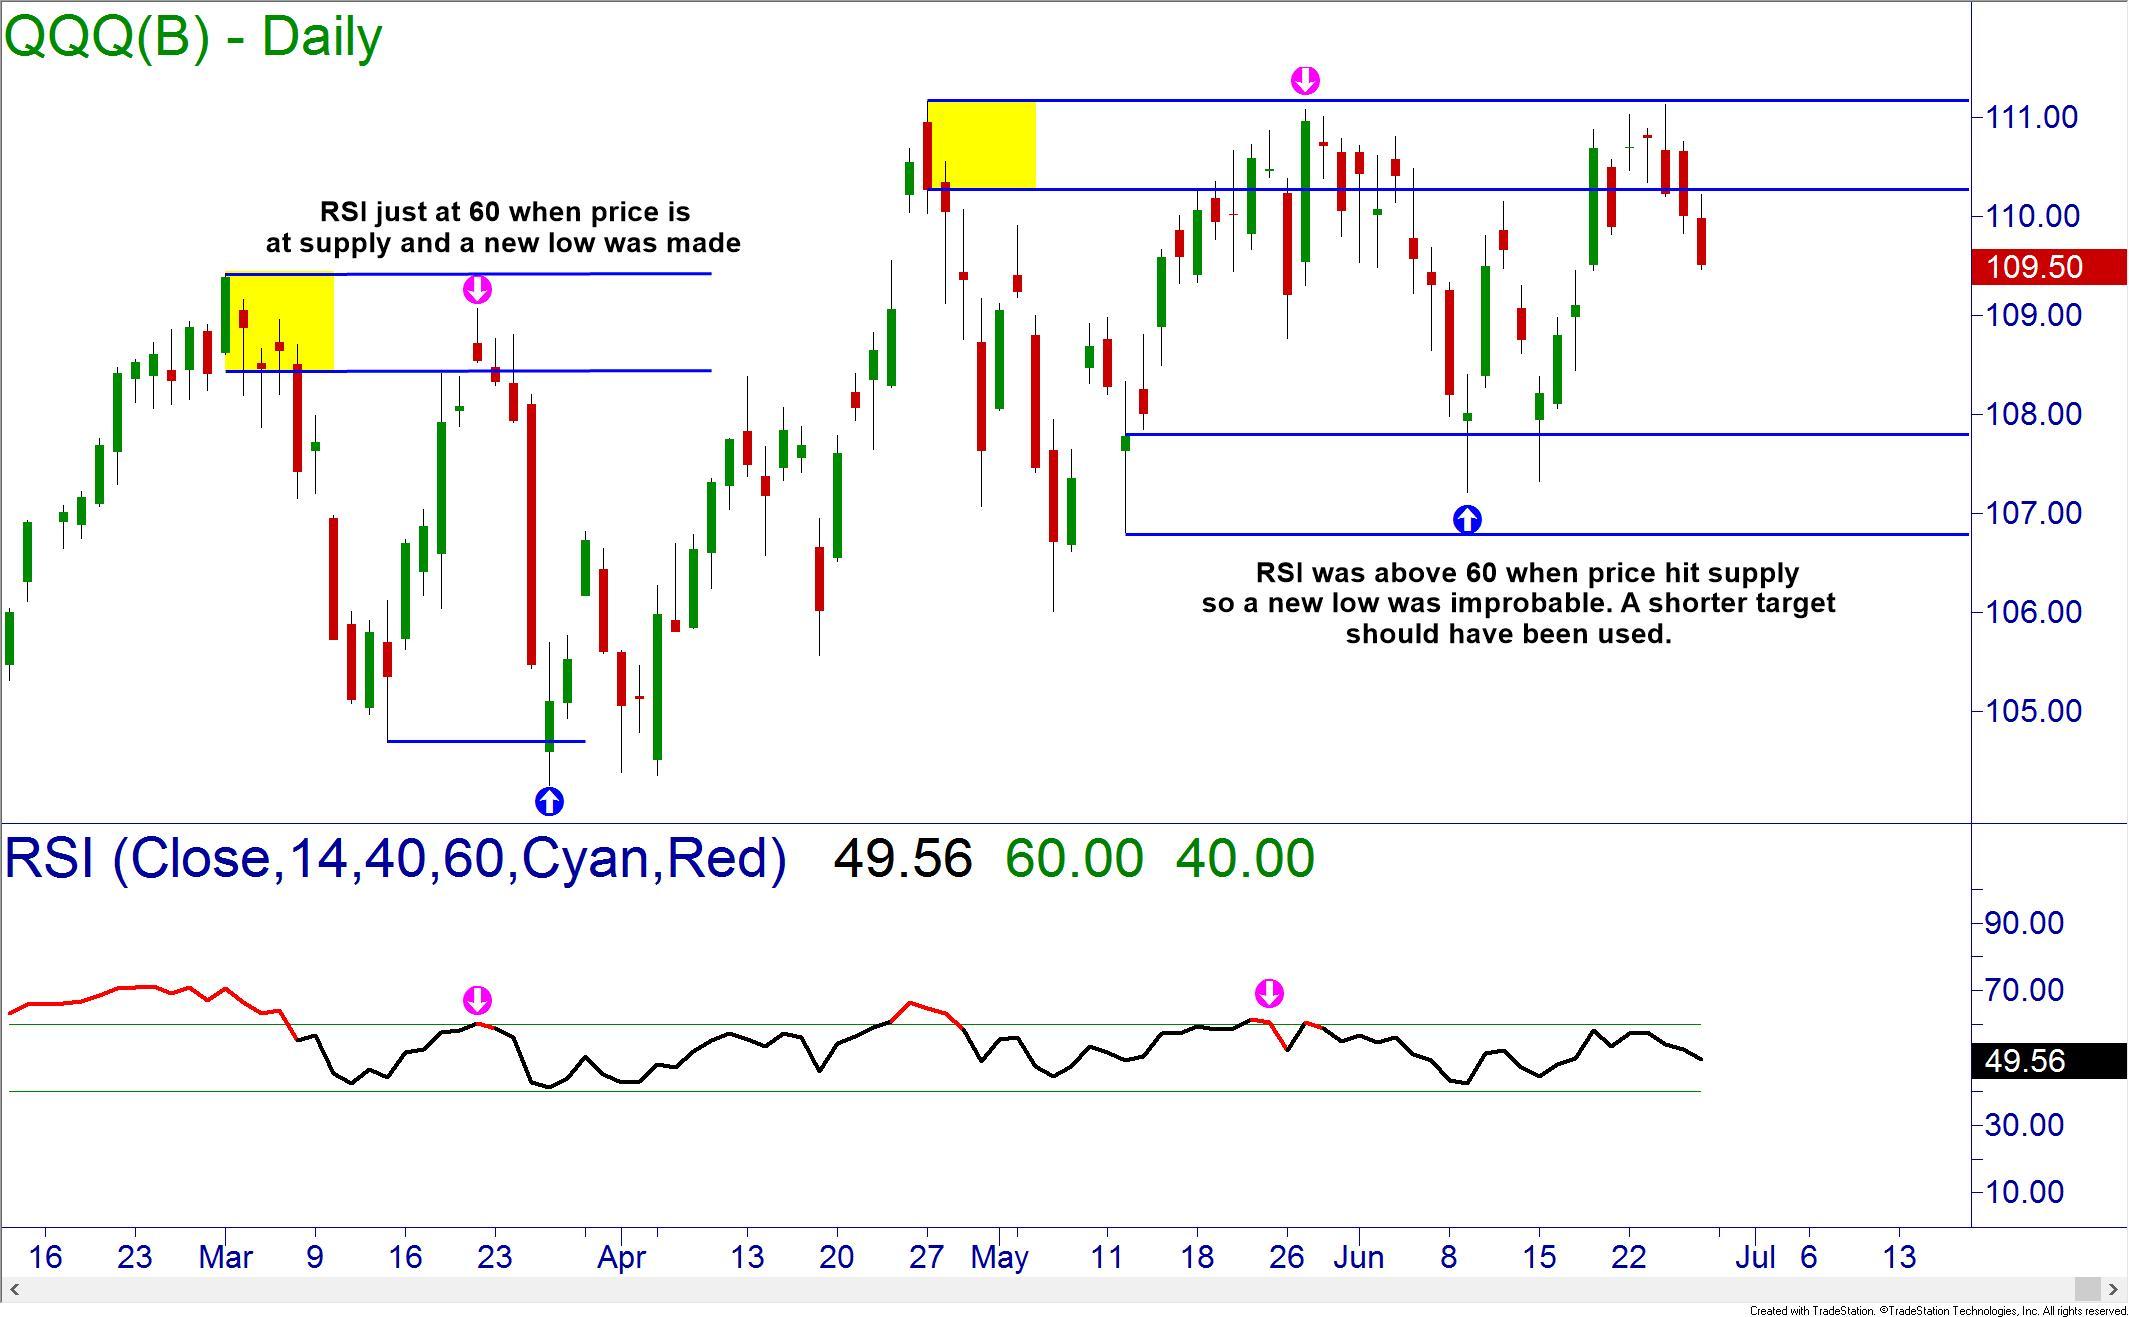
In a downtrend we want to let our shorts go as far as possible to maximize profits. When we see rallies in the bearish trend fail to breach the 60 level on the RSI, then we are still in the downtrend and are likely to see prices continue to break demand levels. If we see the RSI moving above 60 when price hits supply, we may want to look for another trade or have shorter targets as price is unlikely to make new lows if it does bounce from supply. To remember the use of the RSI, I have come up with a saying: “If at demand the RSI is less than 40 then demand will not stand. And, if at supply and the RSI is above 60, then supply is a lie.
Remember to trade with the trend and use price action for your decisions to enter or exit trades. We can use some indicators to assist our trading but never as the decision maker themselves.
On a personal note, the Trader Biker is preparing to ride again.
By the time you read this article I should be on the road. I am going to be teaching a three day Market Timing Class in our Philadelphia office on July 8th-10th and am riding there from my home in San Diego. I plan to camp in National Parks along the way. You can follow me on Facebook or Instagram as Traderbdub.
Information on these pages contains forward-looking statements that involve risks and uncertainties. Markets and instruments profiled on this page are for informational purposes only and should not in any way come across as a recommendation to buy or sell in these assets. You should do your own thorough research before making any investment decisions. FXStreet does not in any way guarantee that this information is free from mistakes, errors, or material misstatements. It also does not guarantee that this information is of a timely nature. Investing in Open Markets involves a great deal of risk, including the loss of all or a portion of your investment, as well as emotional distress. All risks, losses and costs associated with investing, including total loss of principal, are your responsibility. The views and opinions expressed in this article are those of the authors and do not necessarily reflect the official policy or position of FXStreet nor its advertisers.