Using Sectors to Time Market Entries and Exits
|Choosing which stock to trade is always a challenge. There are many screeners available either free or for a small subscription fee. While they can be helpful, another simple technique can be even better in narrowing your selection process and may even offer insight as to when the markets may start to turn themselves.
Markets go through a rotation that is common throughout the world. All modern capitalistic economies work in similar manners and I have applied this analysis with great success to the US, Singapore, European, UK, and Indian equity markets. Let’s face it – we are all people, driven by the same forces of fear and greed when playing in the markets. These emotions make our investing and trading very predictable.
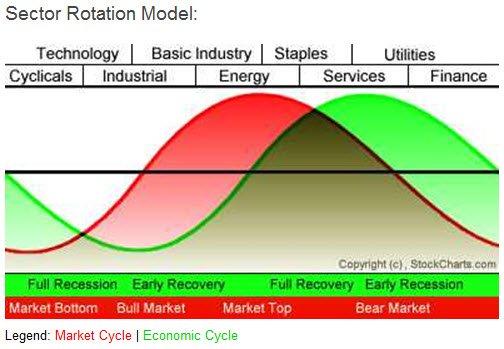
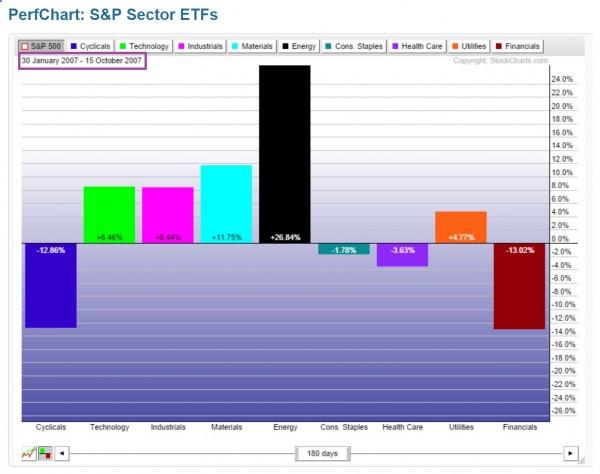
The stock market itself can be a leading indicator for the economy as investors place their money into “safe” sectors that they believe will outperform giving the future outlook of the economy. If you look at the chart below, you can see how the market cycle in red tends to lead the economic cycle in green by approximately three months. This makes sense when you think of how the markets turned downward in October 2007, well before the announcement that the United States and the rest of the world had entered into the 2008 recession.
Choosing which stock to trade is always a challenge. There are many screeners available either free or for a small subscription fee. While they can be helpful, another simple technique can be even better in narrowing your selection process and may even offer insight as to when the markets may start to turn themselves.
Markets go through a rotation that is common throughout the world. All modern capitalistic economies work in similar manners and I have applied this analysis with great success to the US, Singapore, European, UK, and Indian equity markets. Let’s face it – we are all people, driven by the same forces of fear and greed when playing in the markets. These emotions make our investing and trading very predictable.
The stock market itself can be a leading indicator for the economy as investors place their money into “safe” sectors that they believe will outperform giving the future outlook of the economy. If you look at the chart below, you can see how the market cycle in red tends to lead the economic cycle in green by approximately three months. This makes sense when you think of how the markets turned downward in October 2007, well before the announcement that the United States and the rest of the world had entered into the 2008 recession.
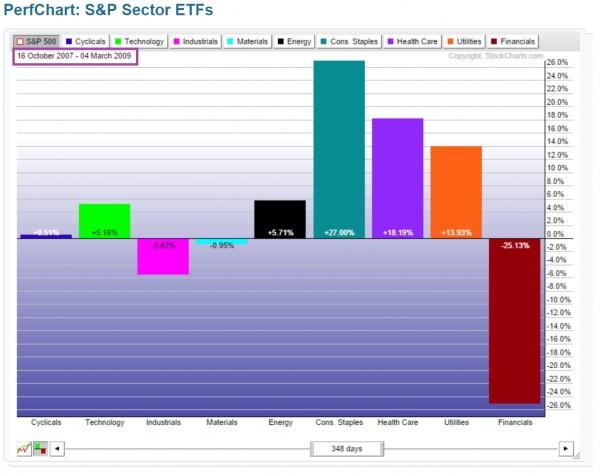
When there is danger on the horizon for the economy and markets, money will start to flow into sectors viewed as “safe havens.” Consumer Staples, Healthcare and Services and Utilities are examples of those safe investmenthaven sectors. The staples and healthcare are things we as a society still spend money on even if the economy starts to slump. Brokers advise their clients to protect their capital and you will see those sectors hold steady or even start to rise when danger appears or economic slowdown is imminent.
The utility sector is one that benefits in two ways from a bear market. First, this sector tends to pay out larger dividends than stocks in other sectors, so those seeking dividend yield are smart to invest here. Secondly, utility companies are usually operating on high debt having issued bonds to finance operations. If the economy is slumping, the Federal Reserve will lower interest rates as a move to stimulate it. The lower interest rate allows the utility company to re-issue new bonds at lower rates to pay off older, higher rate debt. This frees up money for them and increases profitability.
The last sector, Financials, also benefits from lower interest rates. In a lower interest rate environment, money can be borrowed for expanding business operations and consumer purchases to stimulate the economy. When businesses and investors think the end of the recession or slowdown is near, they will start to place money into financial stocks causing them to lead the markets out of the bearish mode.
This is a longer term cycle that could take four to eight years to complete and is therefore, more suited for investors or swing traders looking for signals or an advantage in trading. However, when you are an intraday trader, knowledge of this rotation can also be beneficial. On a day where the markets are bullish, the rotation model can tell you which sectors are best poised to move further in that direction thus improving your returns. The same is true for bearish market days.
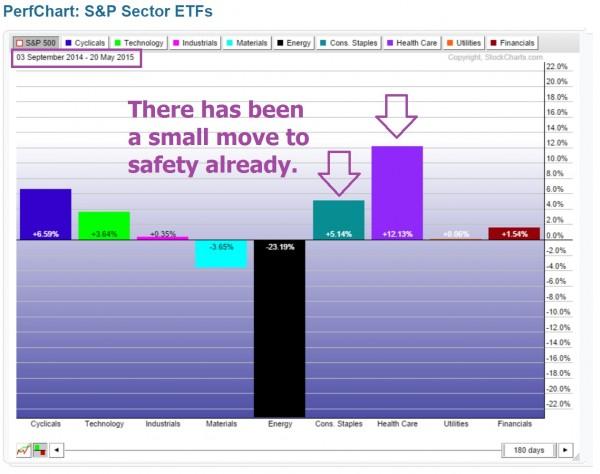
So the big question on most investors’ and traders’ minds is whether the current market environment is going to continue to seek new highs or is primed for a crash. There is no doubt that the markets are overbought and valuations of many securities are extremely high. We can look to see what the sector rotation tells us about where those investors and traders expect both the markets and economy to head.
Looking at the sector rotation over the last six months, there has definitely been a shift into some of the “safety sectors” for investments. This would indicate that the markets are afraid of an imminent correction or crash coming. Should this trend continue, I would not be surprised to see the markets drop during the summer of this year
To learn more, I invite you to speak to an Education Counselor at our Online Trading Academy offices and enroll in our Professional Trader Course, and then to continue your education by joining the Extended Learning Track (XLT) program where we learn to identify the sector rotation using simple tools and analysis and many other techniques for improving your chances for trading success.
Information on these pages contains forward-looking statements that involve risks and uncertainties. Markets and instruments profiled on this page are for informational purposes only and should not in any way come across as a recommendation to buy or sell in these assets. You should do your own thorough research before making any investment decisions. FXStreet does not in any way guarantee that this information is free from mistakes, errors, or material misstatements. It also does not guarantee that this information is of a timely nature. Investing in Open Markets involves a great deal of risk, including the loss of all or a portion of your investment, as well as emotional distress. All risks, losses and costs associated with investing, including total loss of principal, are your responsibility. The views and opinions expressed in this article are those of the authors and do not necessarily reflect the official policy or position of FXStreet nor its advertisers.