Will that Demand Hold or Break?
|Many students email me wanting to know how to tell if a supply or demand zone is likely to hold or break. Understanding this is critical for trading, for if we buy or sell at the wrong time we give up the opportunity to make greater profits or worse, we lose money.
In the Online Trading Academy’s Professional Trader Course as well as the Extended Learning Track, we stress the importance of our Odds Enhancers as a way to filter out weak opportunities and find the best trades that we should take. Although the strategy of using Supply and Demand is relatively simple, traders and investors must know that not every turning point in the market is a high quality trading opportunity. There are many Odds Enhancers, but with knowledge and practice using them becomes second nature and your consistency in the markets generally improves.
An Odds Enhancer that we look at when determining the strength of a zone is how price left that zone. Think of a glass of water sitting on a table. If you were to grab the glass only to find it filled with scalding hot water, you are likely to release your grip very quickly. But if the glass was filled with room temperature water you could hold the glass as long as you would like or even take a sip.
Price works the same way. Traders need to focus on the strength at which price left the origin of the supply or demand zone. If price leaves quickly, it shows a large imbalance of supply and demand and, therefore, a stronger zone.
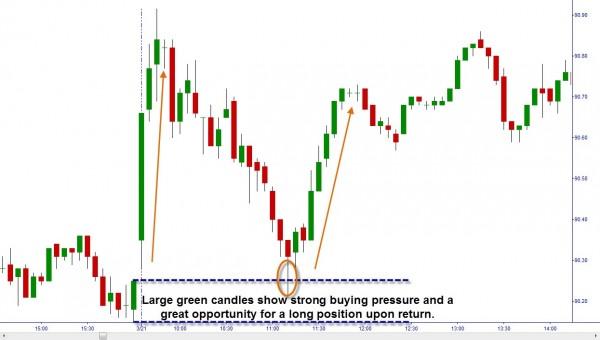
Looking at the following chart we can see that we left the demand zone with large green candles when demand was formed. This means that this is an area where buyers are much stronger than the sellers. The glass is hot! When price returns to that level we would have a high probability buying opportunity since the sellers are weak there and price is likely to rise again.
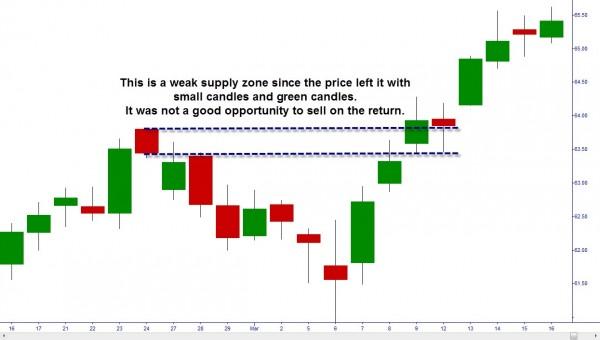
What happens if we leave the area slowly? We would likely see smaller candles and/or a mix or red and green candles. The battle between buyers and sellers is pretty even and no one side has the major advantage. Without clear direction in this zone, prices are less likely to bounce fast.
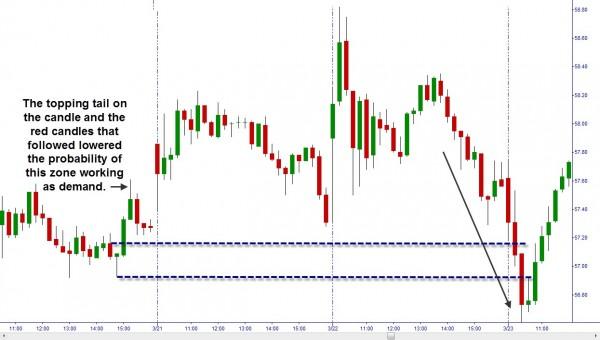
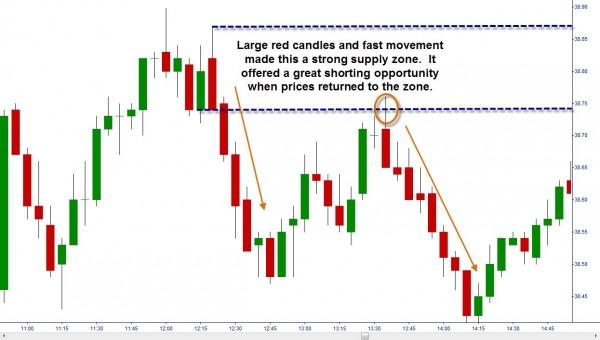
The same can be said for supply zones. For the zone to offer us a higher probability selling opportunity we would want to see a fast drop from that level. On the charts this would be characterized by large red candles, gaps down and/or topping tails on the candles.
If you do not see that occurring you would have a lower probability of success in selling at those levels.
So, now you are aware of one of the Odds Enhancers we can use to increase our chances for success in trading any market and any time frame. To learn the others join us at one of our worldwide education centers and increase your knowledge.
Information on these pages contains forward-looking statements that involve risks and uncertainties. Markets and instruments profiled on this page are for informational purposes only and should not in any way come across as a recommendation to buy or sell in these assets. You should do your own thorough research before making any investment decisions. FXStreet does not in any way guarantee that this information is free from mistakes, errors, or material misstatements. It also does not guarantee that this information is of a timely nature. Investing in Open Markets involves a great deal of risk, including the loss of all or a portion of your investment, as well as emotional distress. All risks, losses and costs associated with investing, including total loss of principal, are your responsibility. The views and opinions expressed in this article are those of the authors and do not necessarily reflect the official policy or position of FXStreet nor its advertisers.