Colorizing Your Trading
|You may have heard that most people fail in their attempt to trade, or that investing should be left to the “professionals.” The truth is that almost anyone can become a successful trader or direct their own investments and achieve their financial goals.
The main reason that people fail in the financial markets is that they believe that there must be some hidden technique or complicated technical tool that they are not using or not using correctly. They will constantly read books on the subject and experiment with new tools only to abandon them when their frustration levels move high enough or when they identify a new tool to use.
To be successful in the financial markets it helps to keep your trading or investing techniques simple. That’s right, for all of the tools and indicators that are out there, the best traders keep it simple and focus on price movement itself for their decisions.
Take price candles for instance, they give you plenty of information that can be translated into profits if you know how to use them. Each candle is usually based on a period of time. As the chartist, you are responsible for deciding what period you want to assign for your candles. A day trader may use five minute candles (every candle shows price movement for five minutes of time) while a swing trader may choose a 60 minute candle. Investors want a larger perspective of price movement so they may use a weekly candle chart.
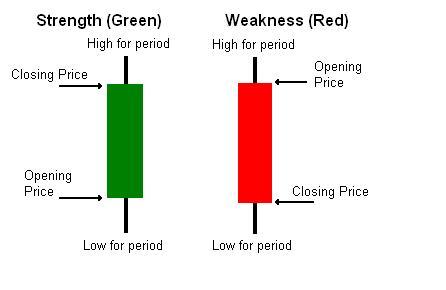
The colored portion of a candle is called the body. The body of the candle is the portion between the opening and closing of the period. A green candle body is colored as such because the closing price of the candle was higher than the opening price. The bottom of the body is the opening price and the top of the body is the closing price. Price was bullish for that period. If prices opened higher than they eventually closed, the candle is bearish and the body is colored red.
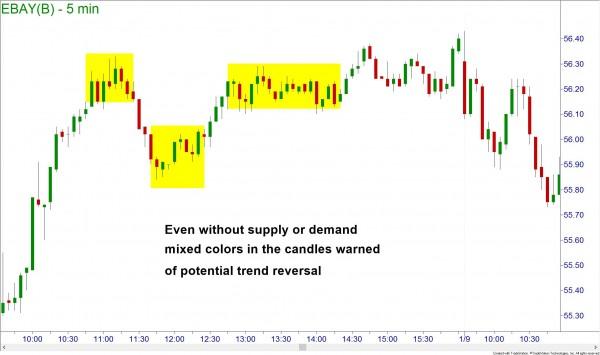
So, why does this matter to the trader/investor? When looking at charts we can look to see which color is dominating in the timeframe in which we are trading. If you look at your chart and see mostly green candles your trend is up and you should look to buy on pullbacks or, if you are long, you should hold on for more profits. When price starts showing mixed colors in the candles price may be pausing or reversing and you may need to book profits by closing your trade.
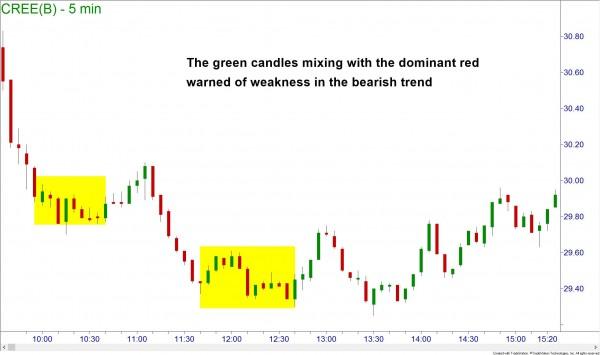
When in a short position you would want to see red candles dominating your chart. If the colors of the candles become mixed as you are nearing demand you may need to book your profits on the trade.
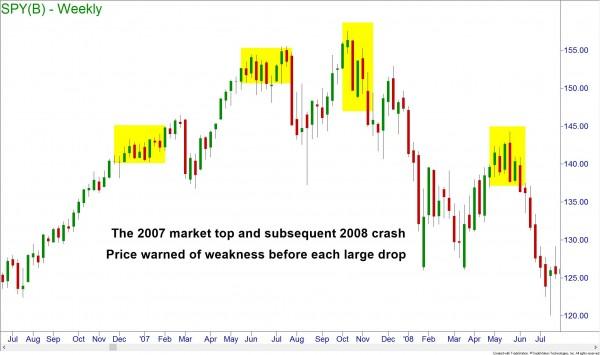
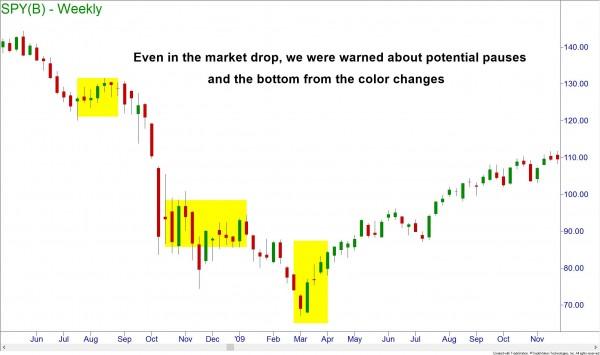
This can work for both intraday trading or for longer term investing as you can see during the 2007 market peak and 2008 crash. Red candles mixing into the green bullish trend in late 2007 warned of market weakness before the turn.
Even during the bear market of 2008 price warned when it was nearing the end of the drop with green candles sprinkled in with the red.
The big question remains, “How do you know whether price is pausing or just reversing?” We would want to exit on a reversal but can hold on for more profits during a pause. The answer lies in coupling supply and demand studies with your candle color reading. The color of the candles is simply an odds enhancer. You can use odds enhancers to improve your chances for success in trading or investing. They are not to be used for making entering or exiting decisions. Learn the right way to trade and invest at your local Online Trading Academy center today!
Information on these pages contains forward-looking statements that involve risks and uncertainties. Markets and instruments profiled on this page are for informational purposes only and should not in any way come across as a recommendation to buy or sell in these assets. You should do your own thorough research before making any investment decisions. FXStreet does not in any way guarantee that this information is free from mistakes, errors, or material misstatements. It also does not guarantee that this information is of a timely nature. Investing in Open Markets involves a great deal of risk, including the loss of all or a portion of your investment, as well as emotional distress. All risks, losses and costs associated with investing, including total loss of principal, are your responsibility. The views and opinions expressed in this article are those of the authors and do not necessarily reflect the official policy or position of FXStreet nor its advertisers.