Programming Your Odds
|While teaching a Professional Futures Trader course in Kansas City last week, I was demonstrating a technique that can predict the morning reversal of the S&P 500 Index and the related futures contracts due to arbitrage opportunities. This is a technique that I have used successfully for years when I traded stocks. It can also be used as an odds enhancer for intraday trading under certain circumstances.
This week I will discuss the overall use of the tool for increasing your chances for successful trading. In next week’s follow up article, I will detail the trading technique I use in order to take advantage of this arbitrage.
For those who may not know, there are a group of institutional traders, called program traders, who have their computers set to recognize mispricing between the S&P 500 Index and the S&P 500 Futures. When the mispricing occurs, they buy the undervalued security (or the stocks making up the index) and sell the overvalued one. This is known as an arbitrage opportunity.
Futures trade with high leverage in comparison to the stocks making up the indexes. Buying 100 shares of the SPY (the ETF that tracks the S&P 500 index) would cost nearly $19,700 at the time of this writing. Even with 2:1 margin, a trader would need $9850 to maintain the position. To trade one contract of the ES, (the S&P 500 eMini future), a trader only needs $5060. Or much less if it is an intraday trade.
Since a trader can put down smaller margin and trade futures in lieu of stocks, they could earn interest on the money they are not using by buying stock. Well, maybe when the US banks actually pay interest again. So the futures exchanges attach a fair value to the futures in order to make them priced similarly to the equivalent index. Additionally, a futures trader will not receive dividends as would the stock or ETF trader. That dividend value is subtracted from the interest to arrive at the fair value.
Futures Fair Value = Interest available on the future contract until expiration minus the dividends to be paid on the stocks until the expiration.
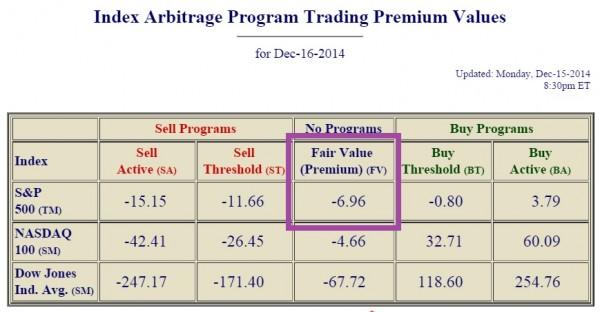
The fair value only changes once a day when the equity market closes. That is when a stock would go ex-div and pay out a dividend and also when there is one less day of interest until expiration. There are plenty of sites that show you the fair value number. I tend to check www.indexarb.com to get the data.
As you can see from the fair value, the S&P Futures should be trading 6.96 points below the S&P 500 Index for the entire day. The buy and sell thresholds tell the program traders when the two are mispriced and ready for an arbitrage opportunity. Should the difference between the two become less than 0.80, some of the program traders will buy the undervalued stocks in the S&P 500 and sell the S&P futures to bring the two back in line. If a larger move on the futures pushes the price above what the index is trading at by more than 3.79, then all of the programs traders should act and a sharp movement in the markets would result.
The opposite would occur should the difference between the S&P index and the futures become too great. If the price gap between the two grows greater than 11.66, then some program traders will buy the futures and sell most of the stocks making up the S&P 500 index. If the price of the futures drops more than 15.15 below the price of the index, then all of the program traders should move in and buy futures and short the stocks. This will result in a larger move in both the index and the futures.
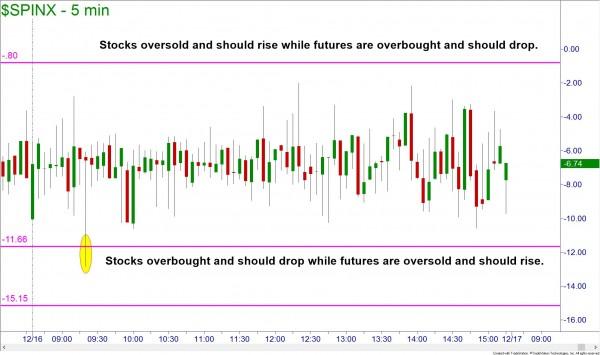
In Trade Station, you can chart the difference between the S&P 500 index and the S&P 500 futures. This is called the premium and the symbol is $SPINX. If we look at the following chart of the premium along with the program trading buy and sell thresholds drawn on the chart, we can identify the times when these programs will move the markets.
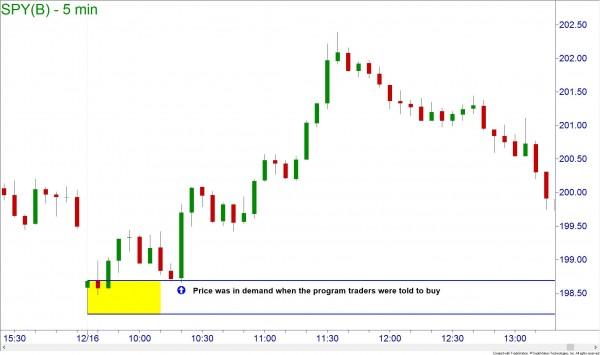
You can see that early in the morning about an hour after the equity markets open, the premium was too low. This caused a rally in the equity markets until the premium was near the -6.96 target. This gave a knowledgeable trader an excellent trading opportunity since price was also at demand. Note that the $SPINX chart is on central time while the SPY chart is eastern.
On any given day, when you are watching your stock approaching a supply zone and are trying to decide whether you should sell or short the level, look at what the premium is doing. If it is approaching the lower levels or sell thresholds, then you should have more confidence that the level will hold. If you are looking at a demand zone on your stock and the premium is moving up to or beyond the buy threshold, you should have a higher confidence of the demand zone working.
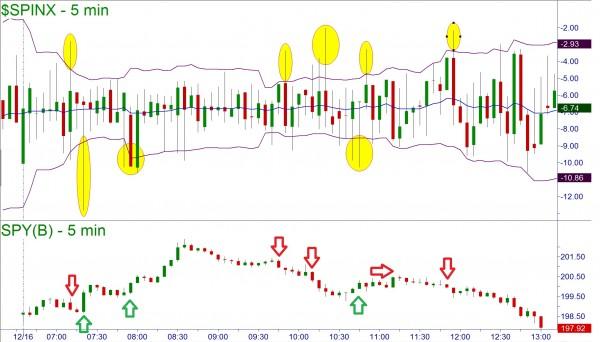
I decided to take it one step further and placed a Bollinger Band set to 20 periods and an exponential moving average on the premium chart. I noticed that when the band was pierced, it often corresponded with an immediate change of trend direction in the SPY ETF.
We must not forget that we need to center our trading decisions on supply, demand, and trend. So while the premium chart with Bollinger Bands is not the holy grail of technical analysis, it is something that a trader can use as a decision support tool.
Information on these pages contains forward-looking statements that involve risks and uncertainties. Markets and instruments profiled on this page are for informational purposes only and should not in any way come across as a recommendation to buy or sell in these assets. You should do your own thorough research before making any investment decisions. FXStreet does not in any way guarantee that this information is free from mistakes, errors, or material misstatements. It also does not guarantee that this information is of a timely nature. Investing in Open Markets involves a great deal of risk, including the loss of all or a portion of your investment, as well as emotional distress. All risks, losses and costs associated with investing, including total loss of principal, are your responsibility. The views and opinions expressed in this article are those of the authors and do not necessarily reflect the official policy or position of FXStreet nor its advertisers.