Is It Trading News or Noise?
|Last week I was teaching a Professional Futures Trader Course in our Irvine office. We were looking at the recent, large price drops in the equity indexes and discussing the reasons behind them. According to the financial news networks, the sell off was caused from a combination of factors including: the Ukraine crisis, weak earnings from companies, and even the Ebola scare in Texas.
When we look at the charts, there are several things we see in price that actually warned of the price movement before the news found excuses for it. The news reports do not matter to the chart technician who can identify the warning signs the markets offer.
I want to stress that my entries and exits for trades are triggered by price action and I use the core strategy taught at Online Trading Academy in my own trading. Technical indicators I apply to my charts are simply an odds enhancer or a support tool.
In September 2013, I wrote an article called, “Modified Odds Enhancer.” In that article I discussed the way I use the technical indicator Relative Strength Index, (RSI). The traditional RSI will not offer you proper buying or selling signals in strong trending markets. Instead of using the indicator for entry signals, I use it more as a filter to keep me out of trades that are less likely to work and also for noting trend changes.
The RSI is an oscillator that measures the strength of up or down moves in price relative to the stock’s previous price movements. The typical readings for this indicator are 70-30. A reading of 70% means that the stock is overbought and likely to drop soon. The RSI crossing below the 70% line is sometimes taken as a sell signal. Conversely, a reading below 30% shows the stock to be oversold and perhaps ready to rise. A buy signal is said to be generated when the RSI crosses above 30.
The problem with using the RSI in this manner is that in a strong uptrend the RSI will typically use 40 as a support level. And when price is in a strong downtrend, the RSI will use 60 as a resistance level. In the previous article, I talk about using the RSI with those new parameters to identify some of those opportunities as we approach supply and demand levels.
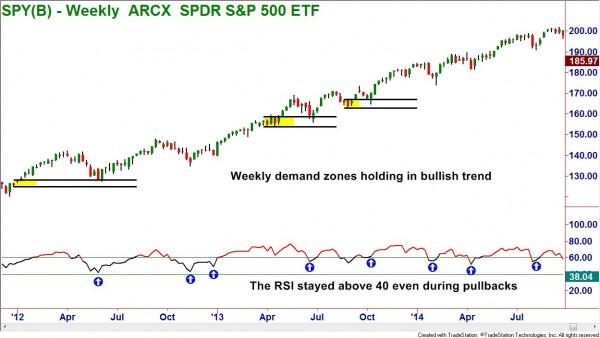
I want to focus on the broad equity markets and see if there were any signs of potential trend change other than the “news” excuses. When a security is in a strong bull trend, the pullbacks hold at areas of demand and the RSI stays above 40.
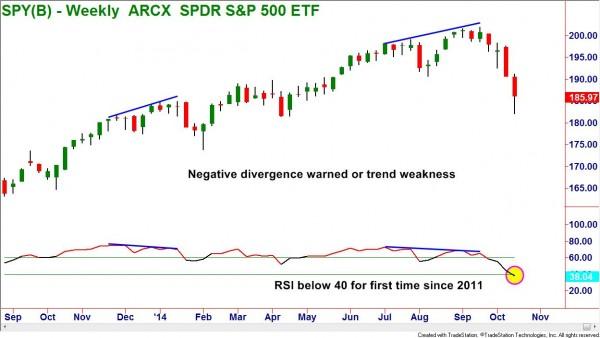
When we see a negative divergence in an indicator it can be a warning of trend weakness. Couple this with the fact that the RSI finally dropped below 40 for the first time on a weekly chart of the SPY since 2011, and you have the makings of a trend reversal.
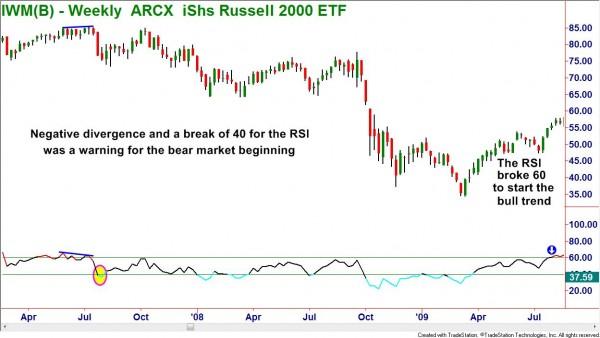
Looking back to the 2008 market crash, the Russell 2000 Index was the first to fall. It peaked in July 2007 while the other major indexes topped out in October.
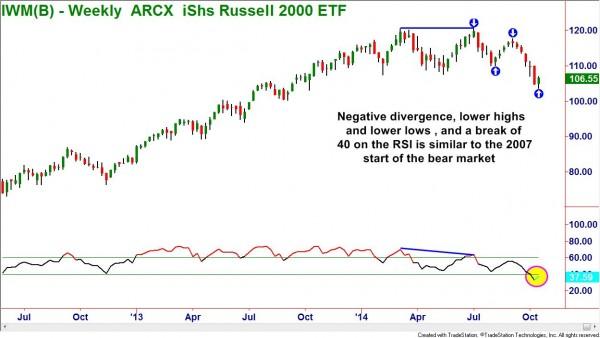
Flash forward seven years to 2014 and we could be looking at the same chart! The Russell 2000 peaked in July of this year and is now making lower highs and lower lows. The RSI on the weekly chart showed negative divergence followed by a break of 40.
This may not be the start of a bear market, but the rise in volatility does warrant protecting your investment and trading money. Remember to trade with the trend and use price action for your decisions to enter or exit trades. We can use some indicators to assist our trading but never as the decision maker themselves.
Information on these pages contains forward-looking statements that involve risks and uncertainties. Markets and instruments profiled on this page are for informational purposes only and should not in any way come across as a recommendation to buy or sell in these assets. You should do your own thorough research before making any investment decisions. FXStreet does not in any way guarantee that this information is free from mistakes, errors, or material misstatements. It also does not guarantee that this information is of a timely nature. Investing in Open Markets involves a great deal of risk, including the loss of all or a portion of your investment, as well as emotional distress. All risks, losses and costs associated with investing, including total loss of principal, are your responsibility. The views and opinions expressed in this article are those of the authors and do not necessarily reflect the official policy or position of FXStreet nor its advertisers.