Candle Powering Your Trading Success
|I wanted to share a recent email I received:
Hi Brandon,
I am one of your students from Philadelphia. I took your Pro Trader and Futures class about this time last year.
I have been wondering what hammer candles really mean. It occurred to me it might be a good subject for one of the newsletter articles. What is really happening with the buyers and sellers with those candles? I think the long wick means emotion. So when we are coming down a drop with red candles and then we get a green hammer, hammer at the top, what does it really mean? I think there must be some panic in the candles. Are there some things for us to know that would help us read these and what’s coming? Another question is, if we see these as part of an opposing zone as we try to set targets, how should we read them? (E.g. a target for a long and the wick is dangling down from a potential opposing zone.)
I’ve wondered about this for a while and wondered if someone like you might address it in a newsletter.
Beth
People seem to think that because so few people are successful in trading that there must be a complicated process to complete in order to make money. The truth is that the simpler we make trading, the more profitable it seems to be. This week I decided to discuss a simple technique that is often overlooked when traders are reading charts. We are all too quick to look at the squiggly lines we call indicators and oscillators and dismiss the simplest signal available to us, PRICE!
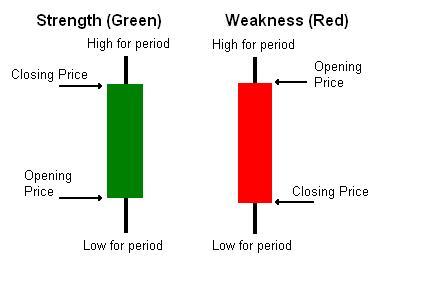
The most common way that price is displayed for most traders is through candle charts. If you are not familiar with the construction of a candlestick, I have included the quick reference below. A green candle usually indicates strength in price and is formed by price closing higher than it opened during that particular period. Conversely, the red candle indicates weakness due to the closing price being lower than the open for that period.
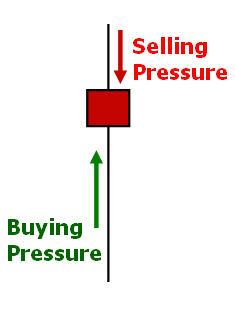
The problem is that many traders end their candle analysis there. You must look to see what the tails (wicks, shadows or whatever else you wish to call them) are telling you. These tails mark the highs and lows of the period. If I asked you what the candle below signifies, you may tell me weakness since it is red.
However with further examination, you will see that there is a long tail to the downside. This means that even though the bears pushed the price lower, there was enough bullish pressure to move price higher before the close of that period. This is actually a bullish candle! Let’s see where it was in the whole trend.
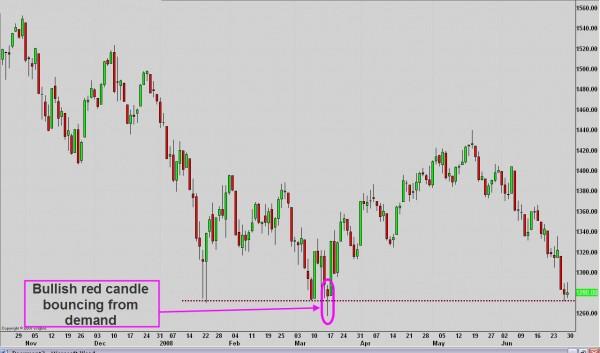
A red candle actually indicated that we were ready to bounce off support with a lot of bullish pressure. You have to listen to the tale the tails are telling you. Any candle tail that is above the real body (colored portion of candle) tells that the bulls were not able to hold price up and the bearish pressure moved prices downward. Any tail below the real body indicates buying pressure.
This becomes especially important when price is nearing a level of supply or demand. By seeing which force is winning (bulls or bears) we can anticipate a bounce or break of that price level and take appropriate action.
Remember that price gives us clues as to the immediate direction it will go. We just have to be open to viewing it and listen to the tale of the tails! You do not need to memorize the “candle patterns” such as a hammer, just learn to read the price action itself and the candles will tell you the tale of price movement.
This is one key factor for my trading success. There are several others that we teach in the Professional Trader course. Be sure to stop by your local Online Trading Academy office to see one of our many superstar traders/instructors for an educational experience you won’t ever forget!
Information on these pages contains forward-looking statements that involve risks and uncertainties. Markets and instruments profiled on this page are for informational purposes only and should not in any way come across as a recommendation to buy or sell in these assets. You should do your own thorough research before making any investment decisions. FXStreet does not in any way guarantee that this information is free from mistakes, errors, or material misstatements. It also does not guarantee that this information is of a timely nature. Investing in Open Markets involves a great deal of risk, including the loss of all or a portion of your investment, as well as emotional distress. All risks, losses and costs associated with investing, including total loss of principal, are your responsibility. The views and opinions expressed in this article are those of the authors and do not necessarily reflect the official policy or position of FXStreet nor its advertisers.