Candle Power
|Trading is simple, but it is not easy! I always tell my students this in my classes. I also tell myself this while I am trading. Most people believe that since so few traders succeed and most end up losing money, that there must be some intricate strategy or high level education needed to become consistently profitable.
The truth is, the simpler we make our trading process and routine, the more likely we will be to have success. A simple strategy is also one that you are more likely to follow on a regular basis. When teaching trading courses, I always go back to the basics. This is often overlooked as students want to hear about some “magical indicator” that will guide them to riches. There is no “magical indicator” other than being able to read price.
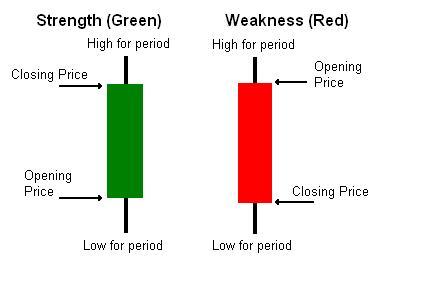
One of the simple strategies we can use to make a decision to enter a trade is price itself and which direction it is indicating it wants to move. The most common way that price is displayed is through candle charts. If you are not familiar with the construction of a candlestick, I have included the quick reference below. A green candle usually indicates strength in price and is formed by price closing higher than it opened during that particular period. Conversely, the red candle indicates weakness due to the closing price being lower than the open for that period.
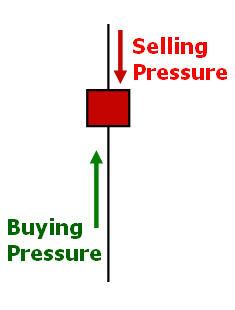
The problem is that many traders end their candle analysis there. You must look to see what the tails (wicks, shadows or whatever else you wish to call them) are telling you. These tails mark the highs and lows of the period. If I asked you what the candle below signifies, you may tell me weakness since it is red.
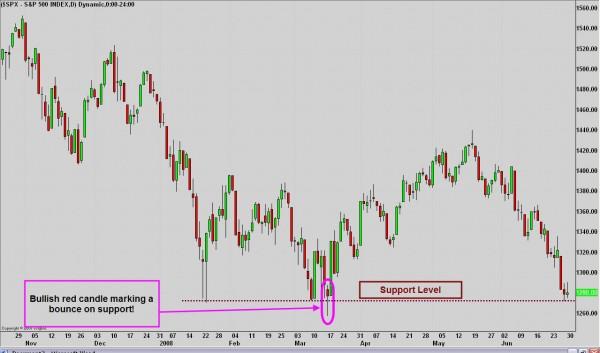
However with further examination, you will see that there is a long tail to the downside. This means that even though the bears pushed the price lower, there was enough bullish pressure to move price higher before the close of that period. This is actually a bullish candle! Let’s see where it was in the whole trend.
A red candle actually indicated that we were ready to bounce off demand with a lot of bullish pressure. You have to listen to the tale the tails are telling you. Any candle tail that is above the real body (colored portion of candle) tells that the bulls were not able to hold price up and the bearish pressure moved prices downward. Any tail below the real body indicates buying pressure.
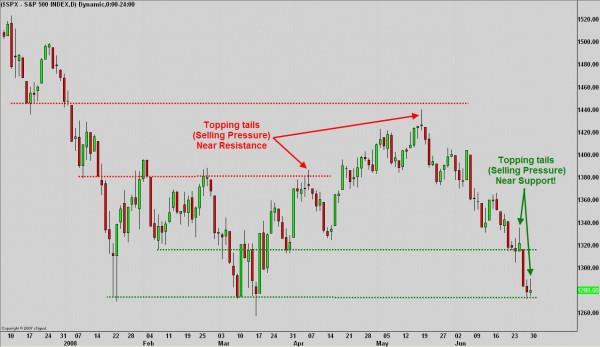
This becomes especially important when price is nearing a level of demand or supply. By seeing which force is winning (bulls or bears) we can anticipate a bounce or break of that price level and take appropriate action.
Remember that price gives us clues as to the immediate direction it will go. We just have to be open to viewing it and listen to the tale of the tails!
Information on these pages contains forward-looking statements that involve risks and uncertainties. Markets and instruments profiled on this page are for informational purposes only and should not in any way come across as a recommendation to buy or sell in these assets. You should do your own thorough research before making any investment decisions. FXStreet does not in any way guarantee that this information is free from mistakes, errors, or material misstatements. It also does not guarantee that this information is of a timely nature. Investing in Open Markets involves a great deal of risk, including the loss of all or a portion of your investment, as well as emotional distress. All risks, losses and costs associated with investing, including total loss of principal, are your responsibility. The views and opinions expressed in this article are those of the authors and do not necessarily reflect the official policy or position of FXStreet nor its advertisers.