Gauging the Reversal
|I was teaching a Professional Trader course in our Philadelphia office a couple of weeks ago and was discussing the market action on the stock Ebay. The students were doing well in the class by shorting the stock during the week the Dow was making new record highs. We decided to look at the bigger picture to see if Ebay was showing signs of a major trend reversal or just a correction before another move higher.
To trade properly, we need to focus on two major components: the trend of the security and the supply or demand zones. The trend tells us when we should be a buyer or a seller. The supply or demand zones tell us where we should actually take action. Mastering how to read these components is part of the Online Trading Academy core strategy.
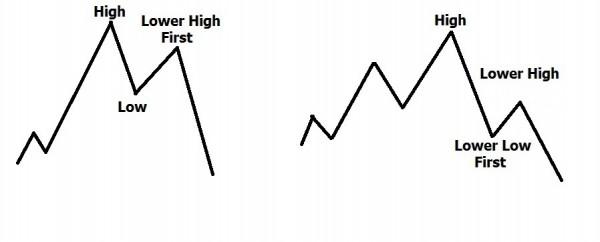
A bullish trend is a series of higher highs and higher lows. A bearish trend is when you have lower highs and lower lows. When the trend shifts from bullish to bearish or vice versa, we see that definition of the trend broken by price. But how it breaks may offer a clue as to how far the new movement may travel before a large reversal.
When looking at the reversal of a bullish trend, we know that the trend is officially over when lower lows are put in. But if price makes a lower high before making the first lower low, then it shows the lack of buying pressure in the markets and a larger likelihood that the resulting bearish trend will be stronger.
As seen in the preceding picture, when price breaks to a new low first before making a lower high, the breakdown is likely to pause and retest before continuing. It could even have a much shorter movement downward before reversing again.
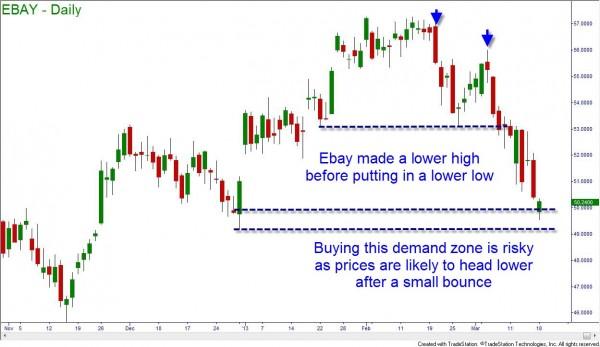
Ebay’s daily chart warned of weakness on both the daily and weekly charts. Looking at the daily chart, price made the classic lower high before breaking to a lower low. This makes buying the stock at the demand zone incredibly risky. Had price dropped first into the demand zone it would have likely offered a better opportunity
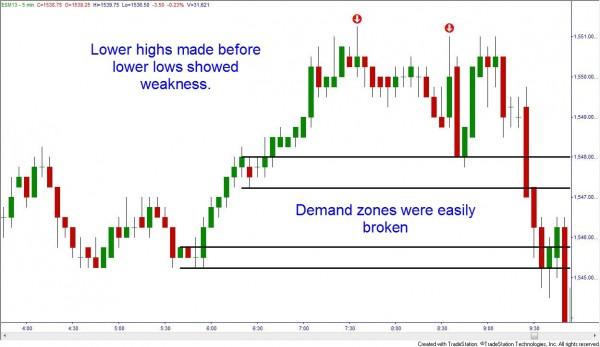
While teaching a Professional Futures Trader course recently, we applied the same rationale to the S&P 500 futures. In the morning, the lower highs signaled that the trend was to be down for the day.
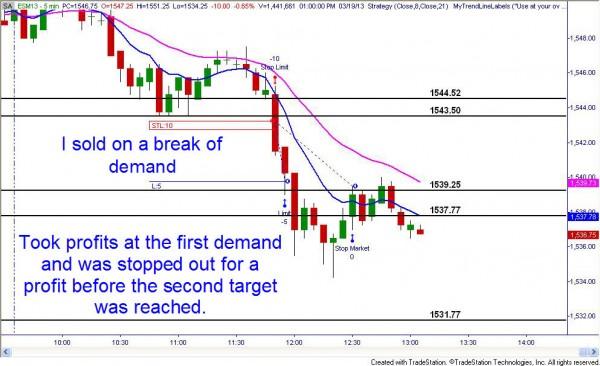
Later in the morning, I shorted a break of a demand zone and targeted two lower demand zones. I was able to take profits at the first demand for half of the position. To protect the remaining contracts, I moved the stop on the remaining position to the first target once that demand zone was broken. Unfortunately that was where I was stopped out but it was still for a profit.
The same strategy is true for bullish reversals of a downtrend. When there is a higher low put in first before a higher high, then the rally is more likely to continue as the sellers have given up and buying pressure has been building. But if the higher high is made before a higher low, you are likely to see a correction and retest of the breakout. You may also see a weak bullish trend resulting from this.
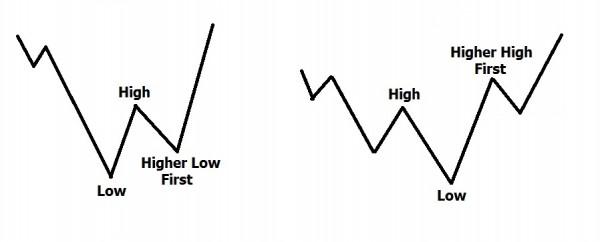
So learn from the markets and from your instructors at Online Trading Academy. You want the best chances for success and the use of odds enhancers is one way to do that.
Information on these pages contains forward-looking statements that involve risks and uncertainties. Markets and instruments profiled on this page are for informational purposes only and should not in any way come across as a recommendation to buy or sell in these assets. You should do your own thorough research before making any investment decisions. FXStreet does not in any way guarantee that this information is free from mistakes, errors, or material misstatements. It also does not guarantee that this information is of a timely nature. Investing in Open Markets involves a great deal of risk, including the loss of all or a portion of your investment, as well as emotional distress. All risks, losses and costs associated with investing, including total loss of principal, are your responsibility. The views and opinions expressed in this article are those of the authors and do not necessarily reflect the official policy or position of FXStreet nor its advertisers.