A Quick Guide To: Order Flow Volume & Delta Suite
|What Is It?
A combined suite of three sophisticated order flow indicators which can be used both together and individually, offering a superior bank-level view of the markets.
What It Does
- Allows you to analyse order flow in a number of ways via effective visual aids plotted automatically on your charts.
- Volume profile: Highlights key order zones in the market including low value areas, high value areas and areas where the most orders were placed in that session creating a map of orders in the market.
- Delta Book & Pressure: Gives powerful analysis of strength and flow of orders in the market with speed showing the speed of transactions being processed at any one time and book pressure looking at the net difference between buying and selling strength as well as the difference between volume traded at bid price and volume traded at ask prices.
- VWAP: Plots the Volume Weighted Average Price of the instrument by taking the Dollar value of all trading periods and then dividing by the total trading volume for the current session. The indicator also plots standard deviations around the average.
Best Thing About It
- Volume profile can be used on a Daily, Weekly & Monthly setting allowing opportunity for order flow trading across all time-frames from important monthly levels right down to key intraday areas. These key order zones work as powerful levels for support & resistance
- Delta Book & Pressure are extremely sophisticated indicators offering powerful intraday trading advantages for capturing breakouts, trend continuation and reversals.
- VWAP can be used across all time frames and is extremely effective in both trending and range-bound markets with retracement to the VWAP providing trend continuation entries and standard deviation levels offering key support and resistance levels
What Does It Look Like?
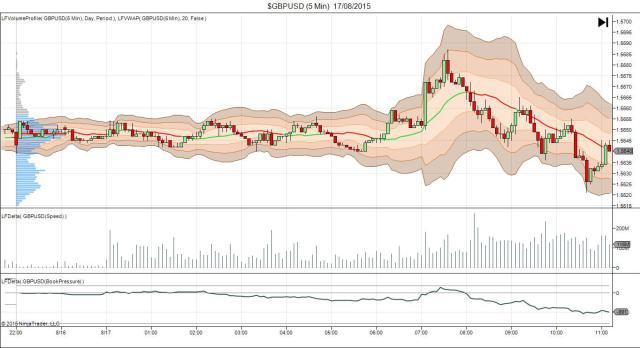
The Suite Has Three Key Elements To It
1 – The horizontal grey,blue and red bars along the left hand side of the chart is the Volume Profile indicator
2 – The coloured bands surrounding price, with a green/red line intersecting, is the VWAP indicator
3 – The two panels in the bottom of the chart show Delta book pressure (bottom panel) and Delta speed (top panel)
Information on these pages contains forward-looking statements that involve risks and uncertainties. Markets and instruments profiled on this page are for informational purposes only and should not in any way come across as a recommendation to buy or sell in these assets. You should do your own thorough research before making any investment decisions. FXStreet does not in any way guarantee that this information is free from mistakes, errors, or material misstatements. It also does not guarantee that this information is of a timely nature. Investing in Open Markets involves a great deal of risk, including the loss of all or a portion of your investment, as well as emotional distress. All risks, losses and costs associated with investing, including total loss of principal, are your responsibility. The views and opinions expressed in this article are those of the authors and do not necessarily reflect the official policy or position of FXStreet nor its advertisers.