Top 3 Price Predictions Bitcoin, Ethereum, Ripple: Overcoming these hurdles may unleash the upside - Confluence Detector
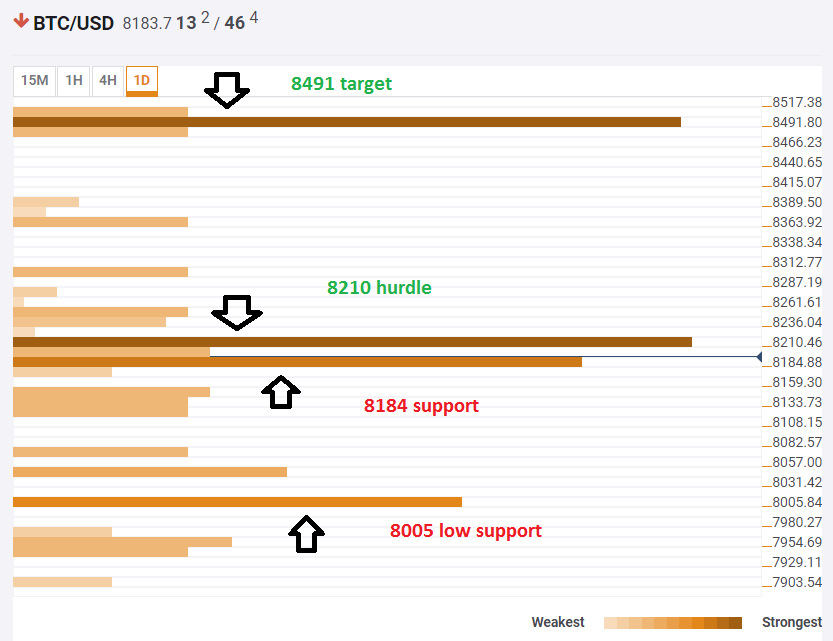
|- Bitcoin is struggling with $8,210, and a decisive break opens the door to a quick run to $8,491 and above.
-
Ethereum is battling a concentration of levels around $467, and a momentous move could send it well beyond $500.
-
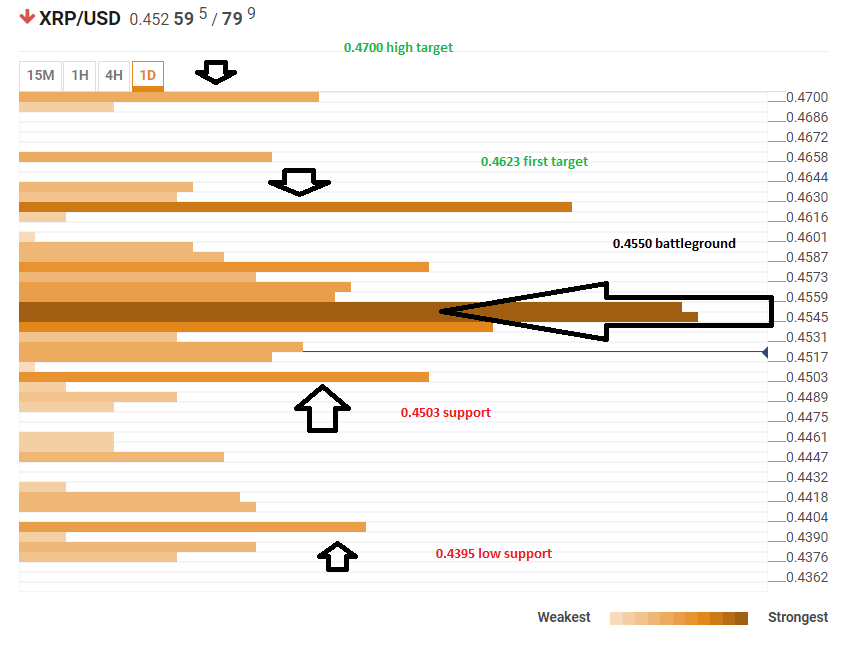
Ripple, the weakest link of late, has to first move above $0.4550 to rally.
BTC/USD 1D
Bitcoin has a major hurdle around $8,210. This is the congestion of the Bolinger Band one-hour Middle (Stidv. 2.2), the Fibonacci 23.6% one-day, the Simple Moving Average 5-one-hour, the Fibonacci 23.6% one-week, the SMA 10-one-hour, the SMA 200-15 minute, the SMA 10-4h, the SMA 50-15m, the SMA 100-15m, and the BB 15-Middle.
While not all resistance levels are as potent as others, the mass concentration makes the price a primary battleground. However, once the cryptocurrency overcomes it, there are very few levels until the $8,491 area. Here we see the confluence of the Pivot Point one-day Resistance 3, the Simple Moving Average 200-one-day, the weekly and monthly highs. Resistance levels here are fewer but robust.
While moving higher may be hard, falling is not that easy either. The $8,184 area and a bit below feature the all-important Fibonacci 38.2% one-day, the SMA 5-one-day, the SMA 50-1h, and the 4h-Low.
The next notable level of support is $8,005. Apart from being just above the round psychological level of $8K, the Pivot Point one-day S1 can also keep the BTC/USD from sliding.
Click to see the Full Confluence Indicator
ETH/USD 1D
The second cryptocurrency regarding market capitalization faces a very dense cluster of resistance levels at $467. The long list consists of no less than 17 indicators at the time of writing: the Simple Moving Average 5-one hour, the SMA 100-15-minute, the Bolinger Band one-hour-Middle, the one-hour low, the SMA 10-15m, the SMA 5-4h, the SMA 5-15m, the SMA 10-4h, the SMA 50-1h, the SMA 50-4h, the SMA 200-15m, the SMA 200-1h, the 1h high, 15m-high, the BB 4h-Middle, the 4h-high, and the solid Fibonacci 61.8% one-day.
Moving above the level is hard, and further technical levels surround it on the upside and the downside. This concentration explains the stickiness of the price. An upside move could slightly be slowed down at $477 which is the confluence of the Fibonacci 23.6% one-week, the BB 4h-Upper, and the Pivot Point one-day Resistance 2.
Another notable level is $496, just under the round number of $500 and also the Bolinger Band one-day Upper. However, higher above, there is no significant level up to at least $525. Getting out of the current mire opens the door to skyrocketing.
The ETH/USD has support at $458 which is the Pivot Point one-day Support 2, the Fibonacci 23.6% one-week, and the BB 4h-Lower. This cushion is quite significant.
There are additional support lines below with notable support at $424 which is the confluence of the Fibonacci 161.8% one-week and the Bolinger Band one-day Lower.
Click to see the Full Confluence Indicator
XRP/USD 1D
Ripple looks messier than its peers, and this is no novelty. The big barrier the XRP/USD needs to overcome is at the area around $0.4550 which is the congestion of the following firm lines: the Fibonacci 38.2% one-day, the SMA 50-4h, the SMA 10-one-day, the SMA 200-one-hour, the Bolinger Band 4h-Middle, the 1h-high, the Simple Moving Average 5-one-hour, the BB 1h-Middle, the SMA 5-15m, the SMA 10-4h, the SMA 10-15m, the SMA 200-15m, the SMA 5-4h, the SMA 50-one-hour. The area is surrounded by additional significant levels that would make any meaningful move hard to materialize.
A break higher opens the door to $0.4623 which is the Pivot Point one-day Resistance 1, the Fibonacci 23.6% one-week, the Bolinger Band 4h-Upper, and the SMA 200-4h. Last week's high at around $0.4700 is the next in line.
Support is not that far off either: $0.4503 is the confluence of the Fibonacci 61.8% one-week, the Bolinger Band one-hour Lower, and the BB 15m-Lower. Further down, the $0.4395 level is notable for the long-term Pivot Point one-week Support 1 level.
Information on these pages contains forward-looking statements that involve risks and uncertainties. Markets and instruments profiled on this page are for informational purposes only and should not in any way come across as a recommendation to buy or sell in these assets. You should do your own thorough research before making any investment decisions. FXStreet does not in any way guarantee that this information is free from mistakes, errors, or material misstatements. It also does not guarantee that this information is of a timely nature. Investing in Open Markets involves a great deal of risk, including the loss of all or a portion of your investment, as well as emotional distress. All risks, losses and costs associated with investing, including total loss of principal, are your responsibility. The views and opinions expressed in this article are those of the authors and do not necessarily reflect the official policy or position of FXStreet nor its advertisers.