Stellar Lumens Price Prediction: XLM aiming to double in price after support was defended
|- XLM is currently trading at $0.081 after defending a critical support level.
- XLM bulls are trying to create a bounce on the daily chart.
Stellar is still up by more than 200% since the crash on March 12 but has lost a considerable chunk of market capitalization over the past month from a high of $2.43 billion to a current low of $1.68 billion.
XLM/USD daily chart
-637354315841842169.png)
XLM has painted a clear parallel channel on the daily chart. The lower trendline was defended seven days in a row during this month. After a massive 15.6% crash on September 3, the RSI got overextended, and the price touched the lower trendline. Bulls quickly jumped in and bought the dip, pushing XLM above the daily 200-MA.
The open-source network is now just above the 200-MA and experiencing a significant decrease in trading volume. The first time XLM price touched the lower trendline was on March 12. Several months later, the digital asset saw a 175% bounce. Similarly, on June 27, after getting close to the lower trendline again, the price bounced 105%, setting a new 2020-high at $0.1149.
Considering that the bulls have defended the lower trendline again, we could see another 100% bounce towards $0.16 over the next couple of months.
XLM/USD 4-hour chart
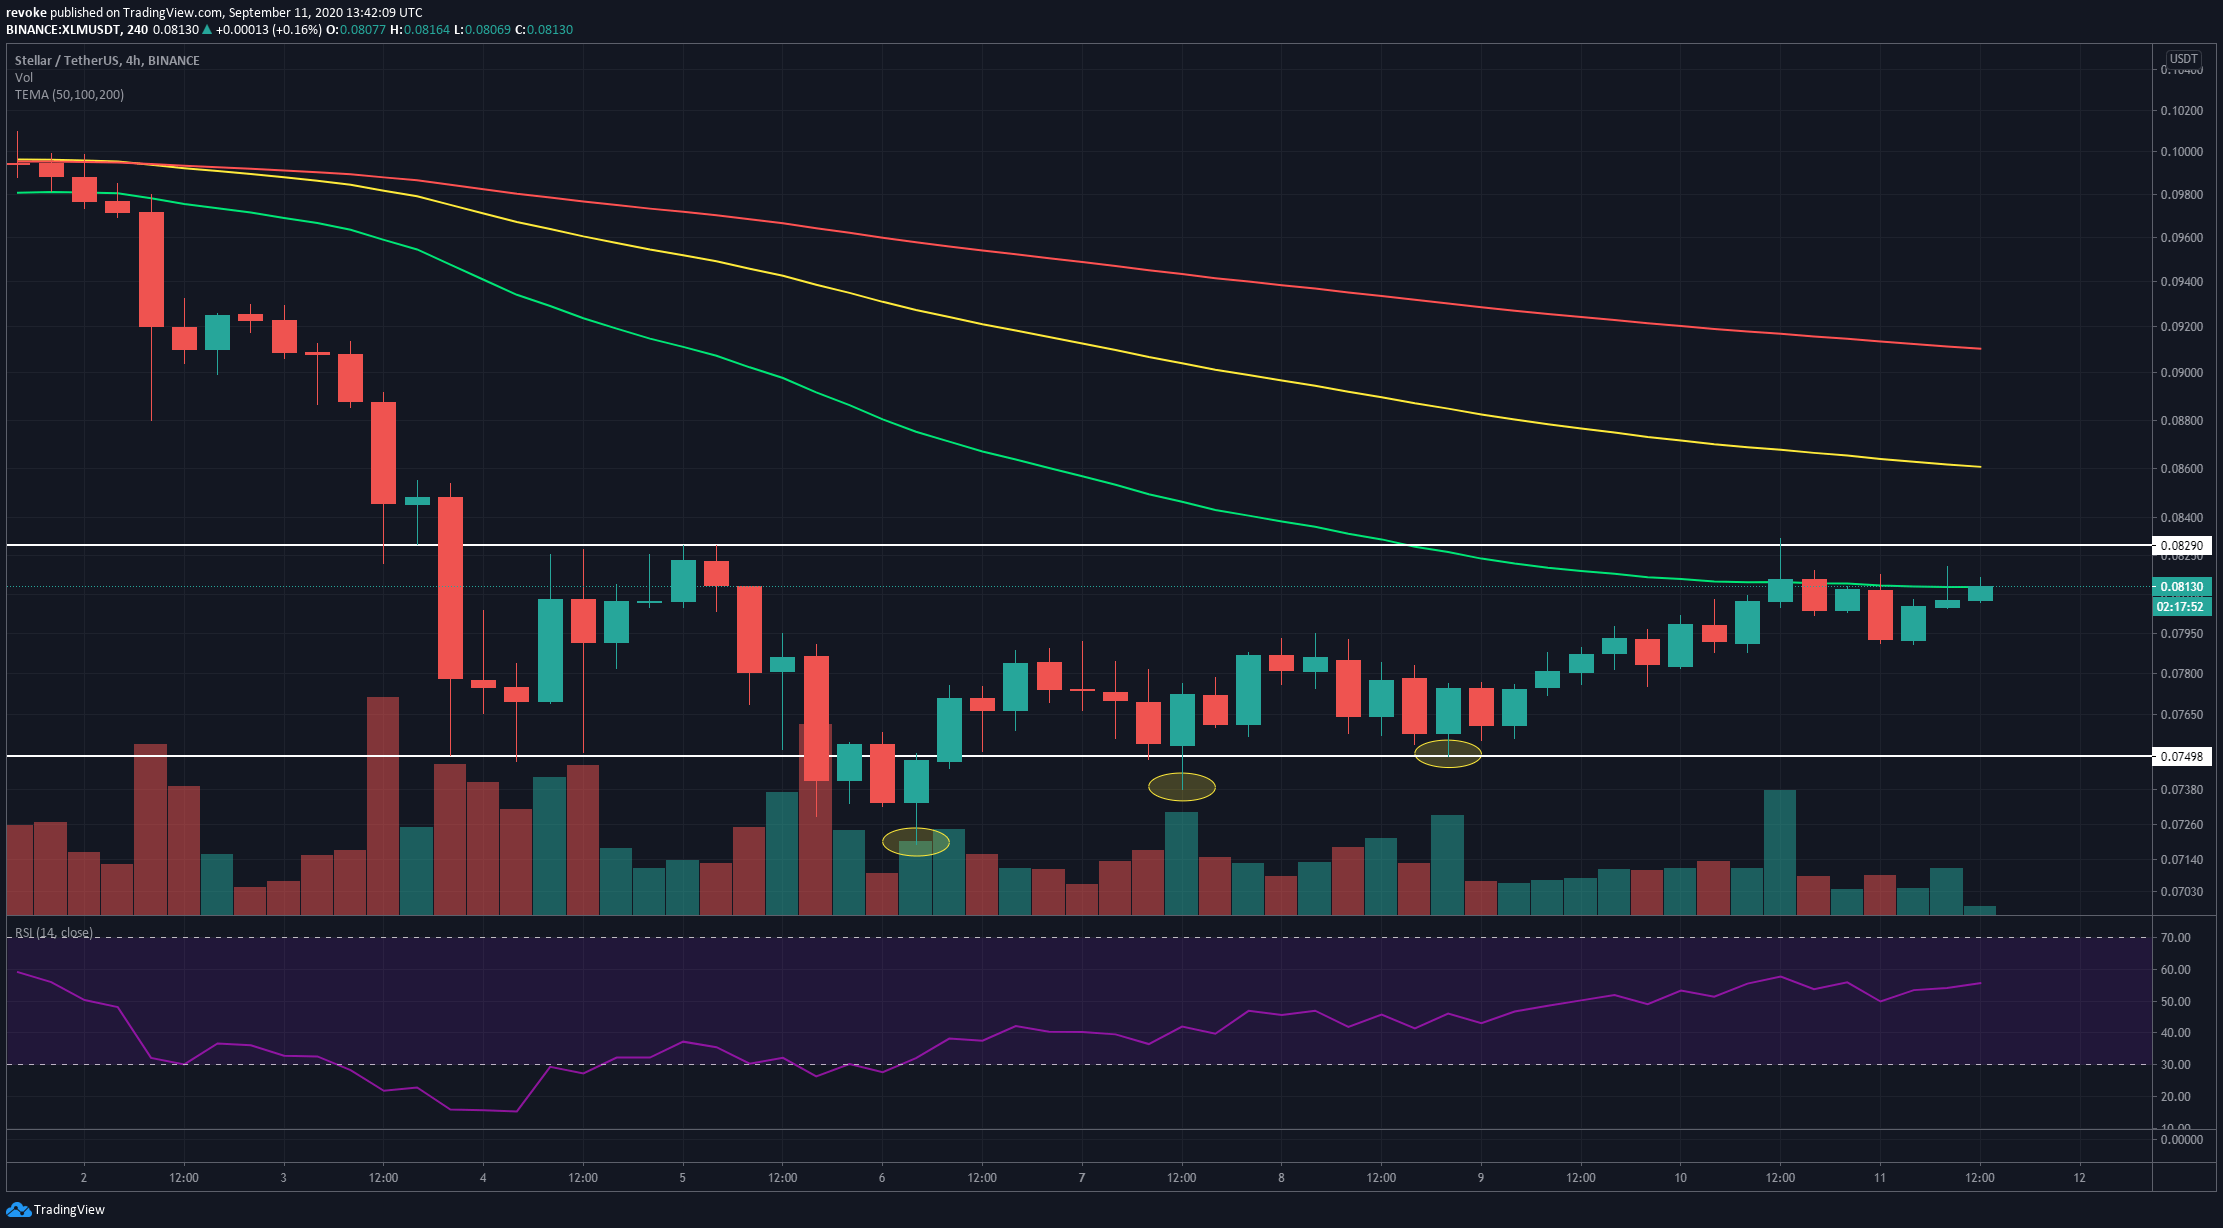
We know the XLM bounce is real because the 4-hour chart favors the bulls, which have created an uptrend. After setting several higher lows, the price of XLM was rejected from $0.082, the next most crucial resistance level. The 50-MA is also acting as a strong resistance point.
If the rejection is stronger, XLM price could drop towards the last low at $0.074 before another leg up. If the bears get enough continuation after $0.074, we could see XLM slide below $0.073, the next support level. Bulls would still have $0.0718 as the low of the crash and overall strongest support point.
Information on these pages contains forward-looking statements that involve risks and uncertainties. Markets and instruments profiled on this page are for informational purposes only and should not in any way come across as a recommendation to buy or sell in these assets. You should do your own thorough research before making any investment decisions. FXStreet does not in any way guarantee that this information is free from mistakes, errors, or material misstatements. It also does not guarantee that this information is of a timely nature. Investing in Open Markets involves a great deal of risk, including the loss of all or a portion of your investment, as well as emotional distress. All risks, losses and costs associated with investing, including total loss of principal, are your responsibility. The views and opinions expressed in this article are those of the authors and do not necessarily reflect the official policy or position of FXStreet nor its advertisers.