Ripple Price Analysis: XRP rejection from crucial pattern spells trouble
|- XRP is currently trading at $0.252 after another possible rejection from a critical pattern on the daily chart.
- The digital asset was looking to catch up with the rest of the market, but selling pressure continues mounting.
XRP has been underperforming since January 2019, losing a significant portion of its market dominance in that span from just above 12% to only 3.2% currently. Bulls are desperately trying to push the cross-border currency above a descending parallel channel on the daily chart.
Minutes ago, the CEO of Ripple, Brad Garlinghouse, opened RippleSwell, an event that brings in prominent speakers from all kinds of economic backgrounds like financial services, blockchain technology, payments, etc. The platform has been running for four years now.
CEO @bgarlinghouse opens #RippleSwell 2020, discussing the current global #payments landscape. Here’s a sneak peek from the kick off! pic.twitter.com/u25U29Is2h
— Ripple (@Ripple) October 14, 2020
CEO @bgarlinghouse opens #RippleSwell 2020, discussing the current global #payments landscape. Here’s a sneak peek from the kick off! pic.twitter.com/u25U29Is2h
— Ripple (@Ripple) October 14, 2020
Another rejection from this pattern will be devastating
In the past four days, the price of XRP has been fighting to stay above the upper boundary of the descending parallel channel on the daily chart. On October 13, it seemed that the price was able to close above it; however, we are now seeing another significant 1.5% rejection, dropping the price below the trendline again.
XRP/USD daily chart
Although the candlestick hasn’t closed yet, there are several other indicators in favor of the bears. For instance, the TD sequential indicator presented a sell signal on October 12, which seems validated by the move we observe in the past 24 hours.
For now, the 50-SMA and the 100-SMA are acting as support levels. A breakout below these two support points can potentially push XRP down to the middle of the descending parallel channel at $0.2225, which coincides with the 200-SMA.
XRP Holders Distribution Chart
On the other hand, there is some good news for the bulls. Looking at the Holders Distribution chart provided by Santiment, we can observe an increase in the number of whales with at least 10,000,000 XRP coins, at least $2.5 million. This number saw a low of 307 on October 10 but has increased to 310 currently.
Because the current daily candlestick hasn’t closed yet, there is still a chance for the bulls to push the price back above the upper boundary of the descending parallel channel. In this case, using the width of the channel, we can determine the next price target, which lands at $0.3.
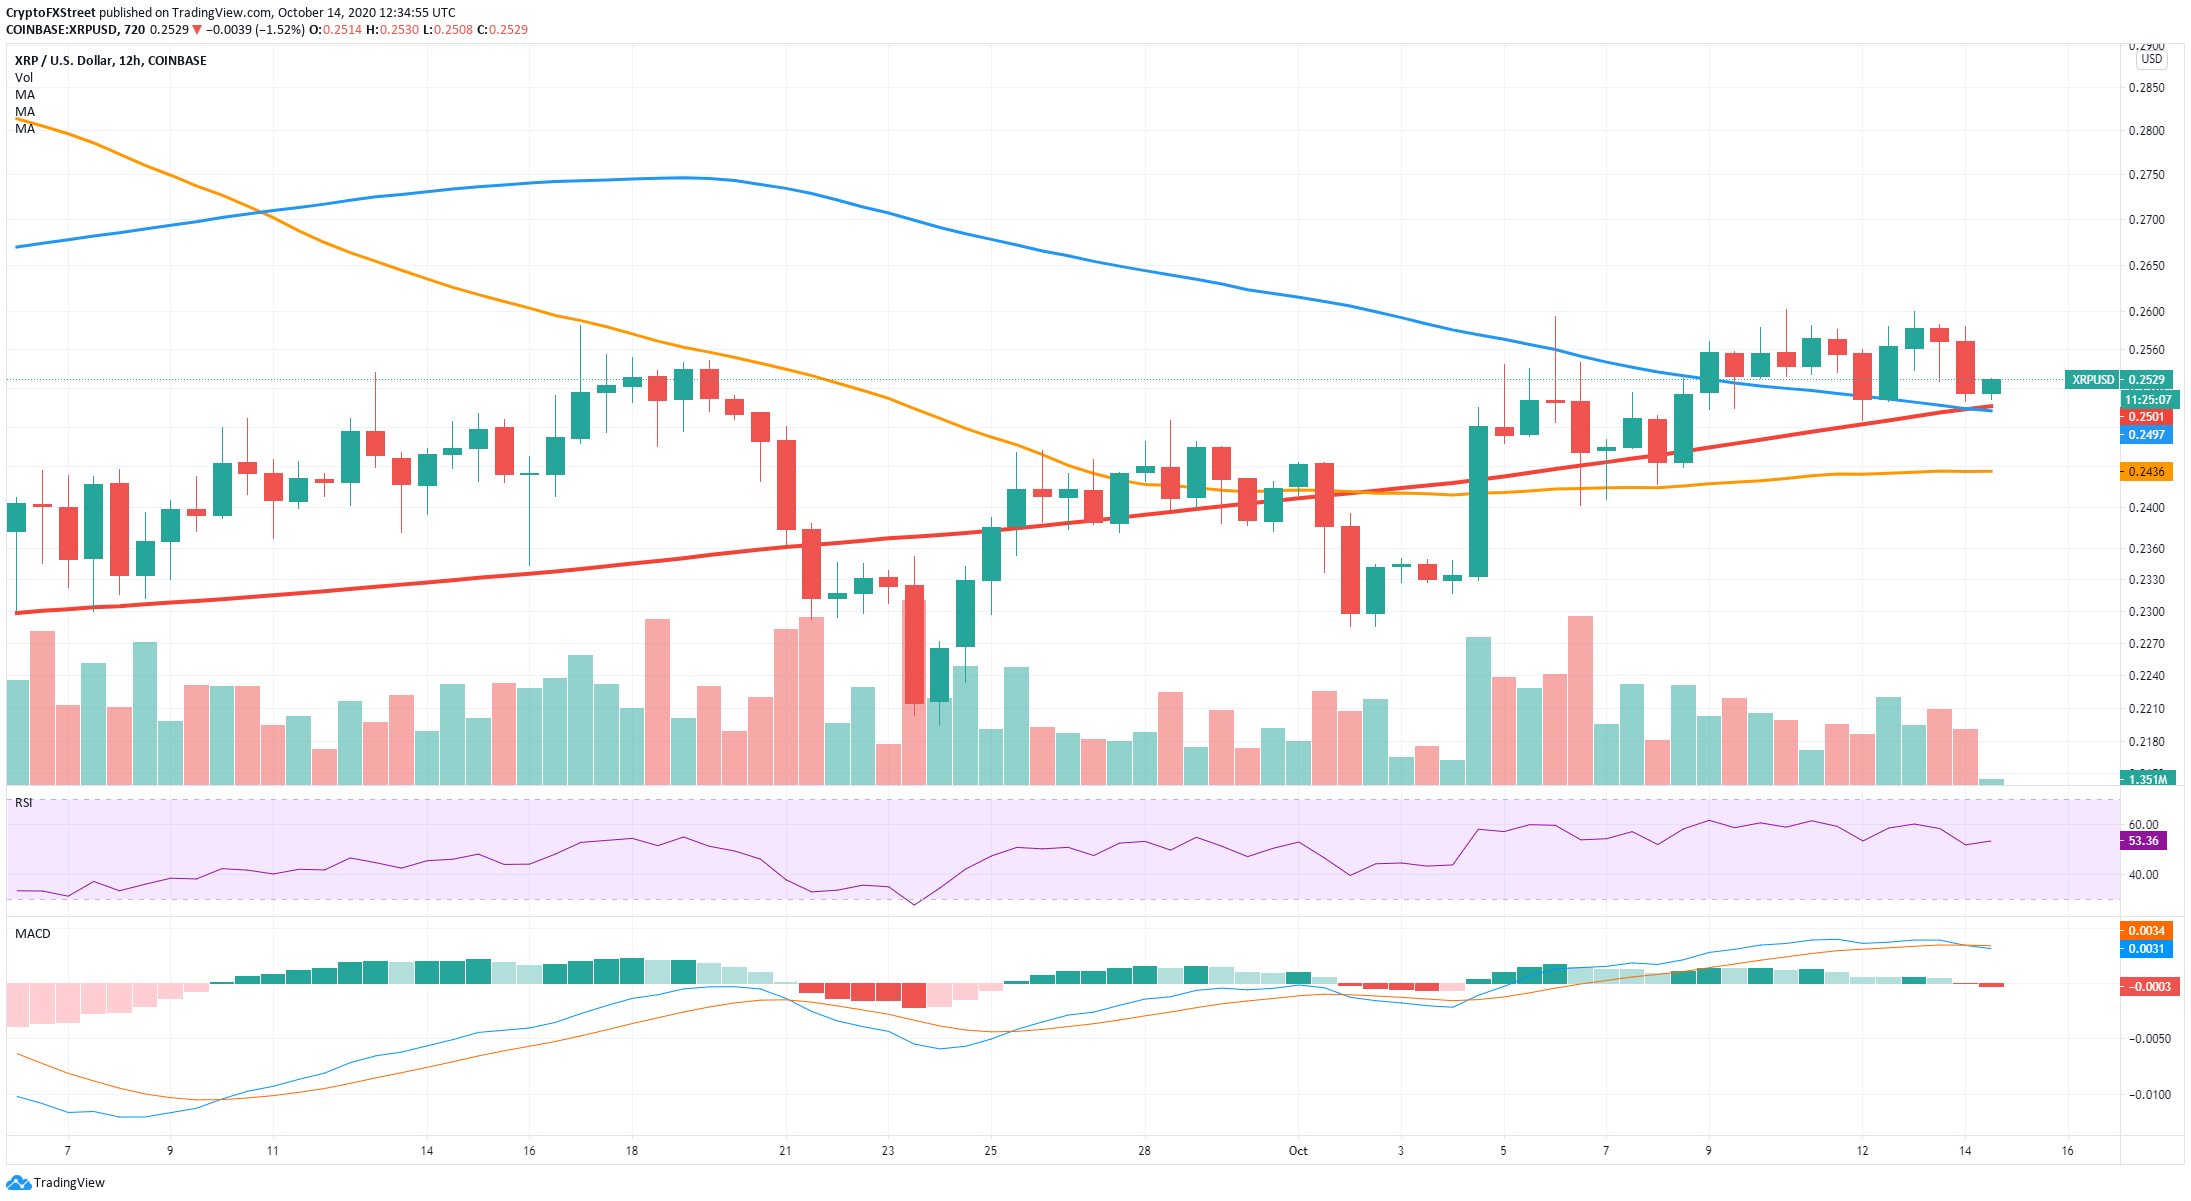
XRP/USD 12-hour chart
Additionally, on the 12-hour chart, the most recent rejection doesn’t look as bad, considering XRP is defending the 200-SMA and the 100-SMA. The uptrend here is still intact as the low at $0.2506 is a higher low compared to the last one at $0.2487.
Crucial points to watch out for
Several indicators have turned bearish for XRP on the daily chart. Most notably, the current rejection from the upper boundary of the descending parallel channel and the sell signal presented by the TD sequential indicator. The next target price for the bears would be $0.2225, right in the middle of the channel.
On the flip side, there seems to be an increase in the number of whales holding XRP, and bulls are defending two critical support levels on the 12-hour chart. A breakout above the descending parallel channel can push the digital asset up to $0.3
Information on these pages contains forward-looking statements that involve risks and uncertainties. Markets and instruments profiled on this page are for informational purposes only and should not in any way come across as a recommendation to buy or sell in these assets. You should do your own thorough research before making any investment decisions. FXStreet does not in any way guarantee that this information is free from mistakes, errors, or material misstatements. It also does not guarantee that this information is of a timely nature. Investing in Open Markets involves a great deal of risk, including the loss of all or a portion of your investment, as well as emotional distress. All risks, losses and costs associated with investing, including total loss of principal, are your responsibility. The views and opinions expressed in this article are those of the authors and do not necessarily reflect the official policy or position of FXStreet nor its advertisers.