If you are a "Hodler" here is where you could find support in Bitcoin
|- Bitcoin has crashed in today's session and has lost about 6.75% of its value.
- There are some longer-term support levels that could stem the losses.
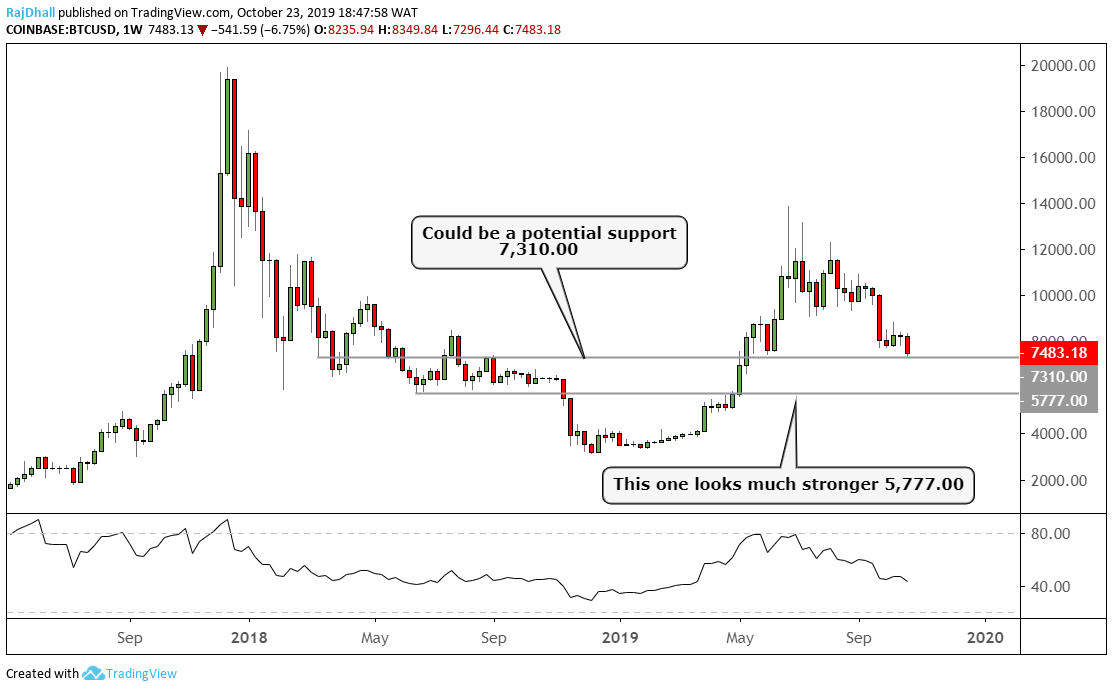
Below is the weekly BTC/USD chart and you can see we are heading to some key support zones.
Today the price of Bitcoin fell and the price is now headed toward the 7,310.00 support used as a resistance zone on the week of the 3rd September 2018.
Also in the 2019 Bitcoin bull run the price also used the level as support before continuing the uptrend to reach 14k.
Now, this level could hold but the main support could be considered to be at 5,777.00 which has historically provided more support.
There are some also key round numbers between the points most notably 6k and 7k. They are always worth keeping an eye on.
Information on these pages contains forward-looking statements that involve risks and uncertainties. Markets and instruments profiled on this page are for informational purposes only and should not in any way come across as a recommendation to buy or sell in these assets. You should do your own thorough research before making any investment decisions. FXStreet does not in any way guarantee that this information is free from mistakes, errors, or material misstatements. It also does not guarantee that this information is of a timely nature. Investing in Open Markets involves a great deal of risk, including the loss of all or a portion of your investment, as well as emotional distress. All risks, losses and costs associated with investing, including total loss of principal, are your responsibility. The views and opinions expressed in this article are those of the authors and do not necessarily reflect the official policy or position of FXStreet nor its advertisers.