EOS/USD technical analysis: The technical pattern has just broken to the downside
|- EOS/USD is one of the worst-performing altcoins today after the price fell 7.18%.
- Most of the crypto majors are trading lower today as sentiment remains soft.
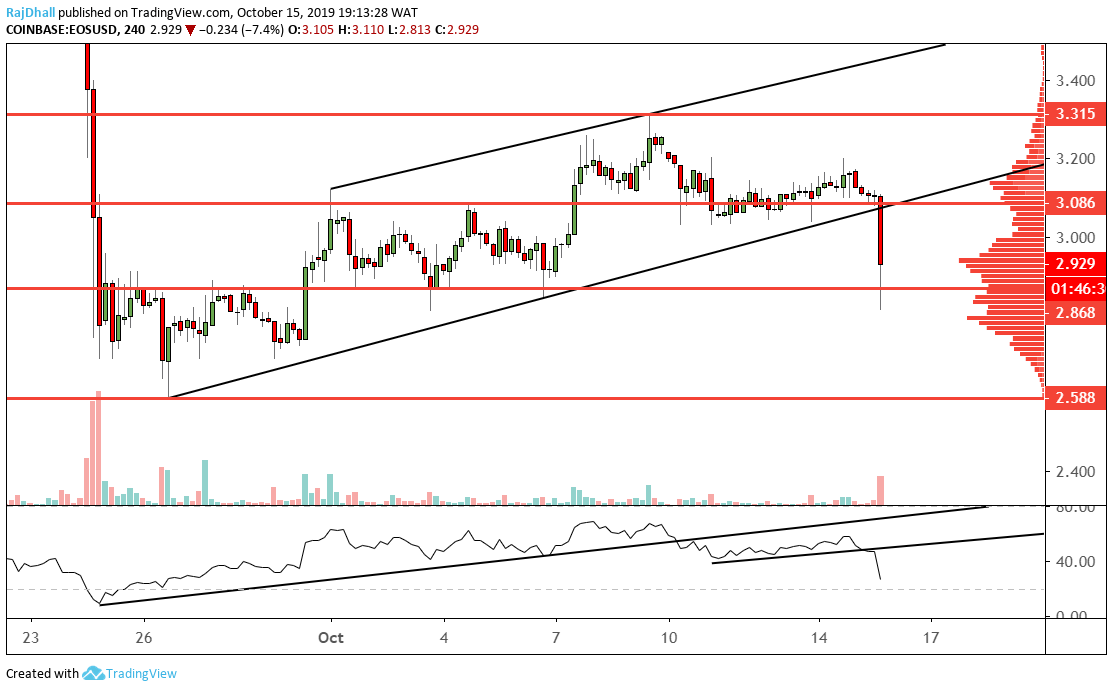
The pair has broken a bear flag formation that formed on the four-hour chart and is now heading to the base of the formation at 2.588.
The psychological 3.000 level has also been broken now and the price is currently holding at 2.939 after finding some support at 2.868 a level used five times in the past as support and resistance.
The relative strength index (RSI) has also broken lower and taken out two trendlines in recent times. The indicator has not reached the oversold level which could suggest there is some more downside momentum on the way.
From a volume perspective, it really seems like the sellers are in control as this move gave us the highest spike in volume since September 27th when the market found some support at 2.729.
In regards to the mean value area, the price is currently holding there. 2.935 is the price where most contracts changed hands on the Coinbase exchange and could be used as a pivot level.
Now the lower high lower low formation has been made a run on the 2.588 wave low could be the next move. If that level breaks we are sure to have confirmed a new downtrend.
Information on these pages contains forward-looking statements that involve risks and uncertainties. Markets and instruments profiled on this page are for informational purposes only and should not in any way come across as a recommendation to buy or sell in these assets. You should do your own thorough research before making any investment decisions. FXStreet does not in any way guarantee that this information is free from mistakes, errors, or material misstatements. It also does not guarantee that this information is of a timely nature. Investing in Open Markets involves a great deal of risk, including the loss of all or a portion of your investment, as well as emotional distress. All risks, losses and costs associated with investing, including total loss of principal, are your responsibility. The views and opinions expressed in this article are those of the authors and do not necessarily reflect the official policy or position of FXStreet nor its advertisers.