ChainLink Price Analysis: LINK whales go into buying frenzy despite the decline in prices
|- LINK is currently trading at $10.79, and it’s down around 47% since its all-time high.
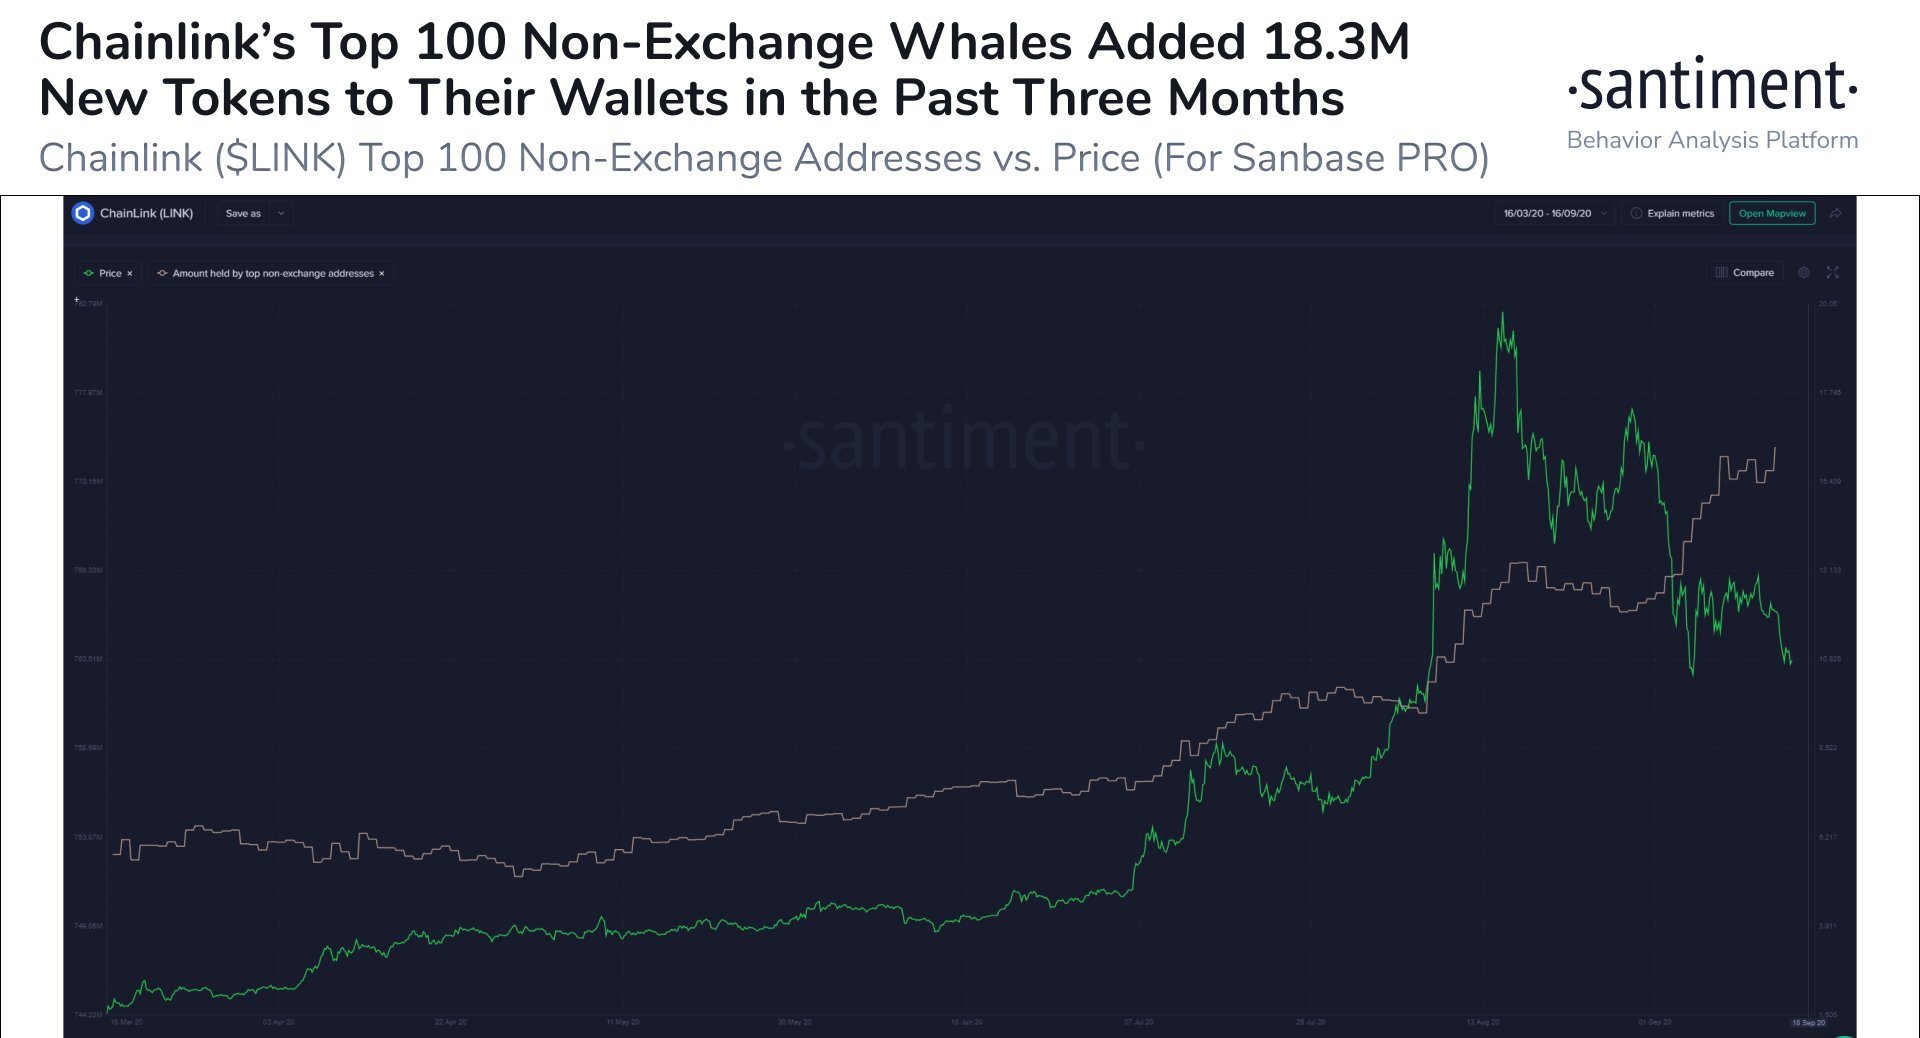
- According to various metrics, LINK whales are still buying many coins in the past three months.
ChainLink hit a new all-time high at $20.11 on August 16 and was outperforming the market by a lot. Unfortunately, the selling pressure eventually hit LINK, which has seen a notable pullback towards $9.1.
According to a recent report by Santiment, it seems that LINK’s top 100 non-exchange whale addresses have added around 18.3 million tokens to their wallets, approximately $200 million at current prices, in the past three months. This fact is notable because LINK lost almost 50% of its value in the past month alone.
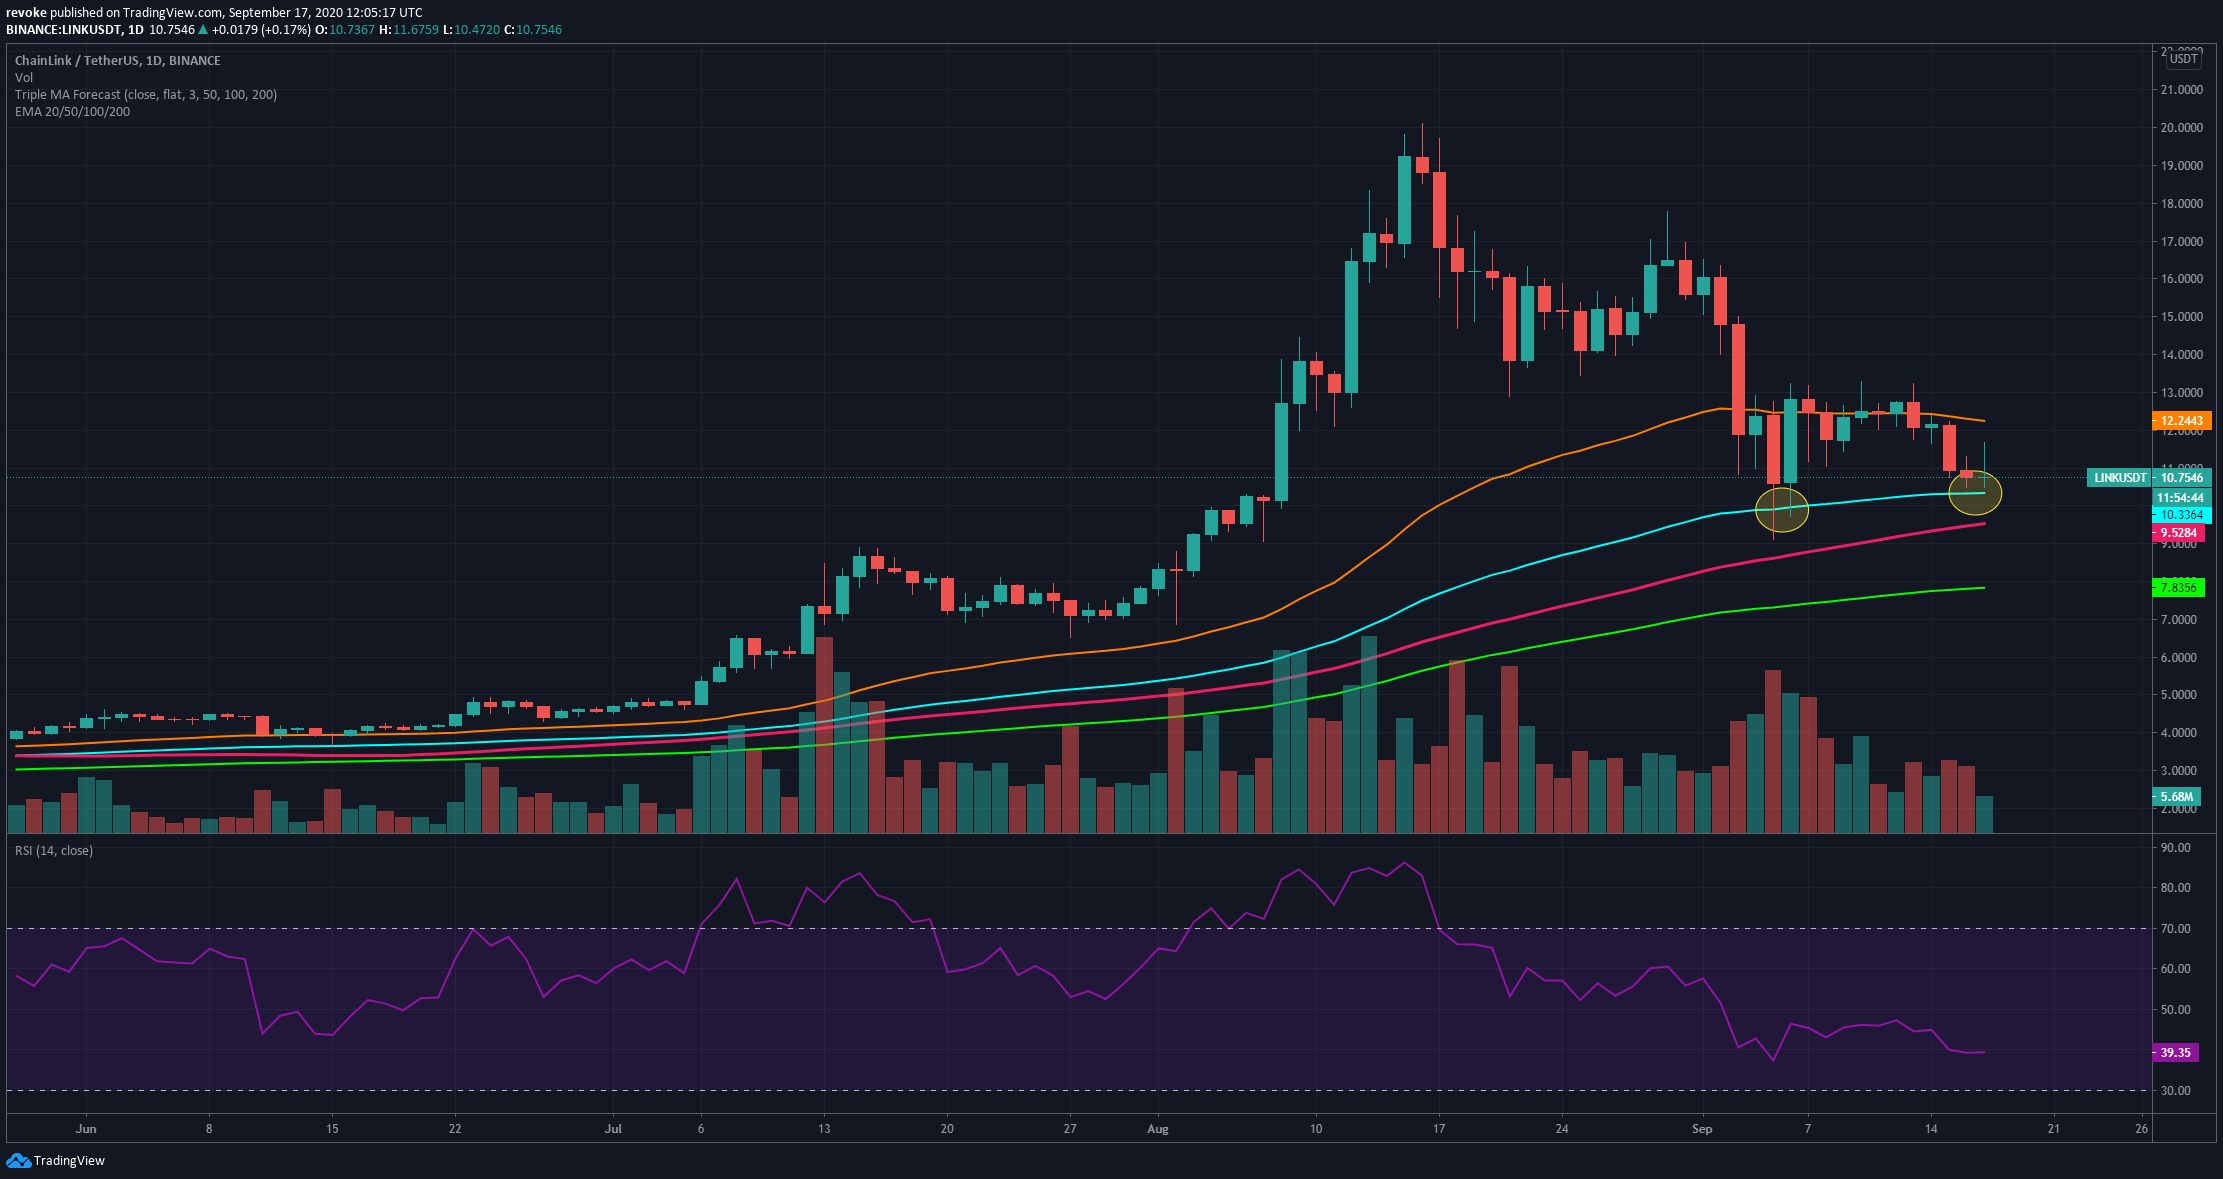
LINK/USD daily chart
It seems that the 100-EMA has been acting as a strong support level for LINK in the past two weeks, even though the price did pierce this support twice on September 5 and 6. Further down, bulls can find more support in the form of the 50-MA at $9.52 and the low at $9.1.
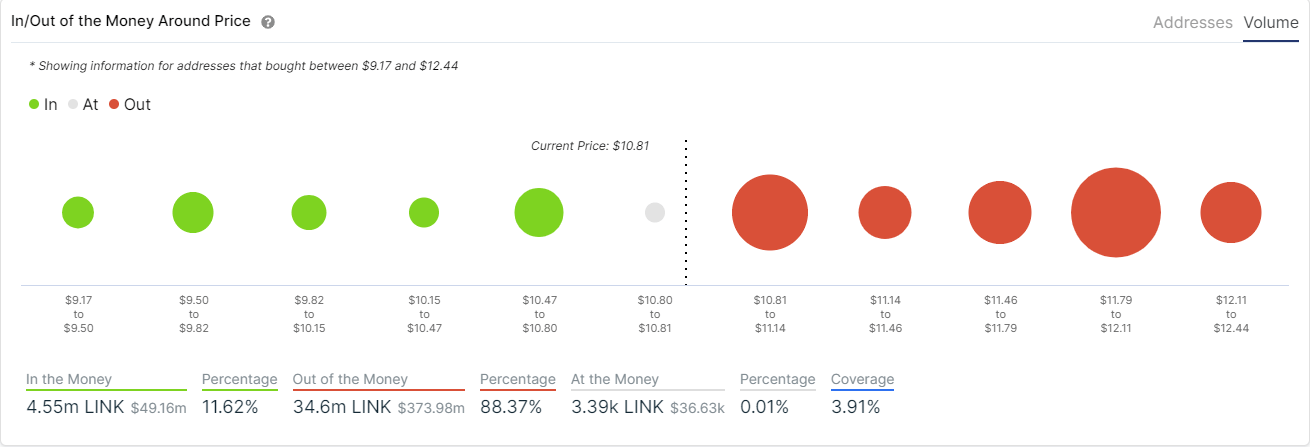
Unfortunately, looking at the IOMAP chart, the resistance encountered by the bulls is far greater than the support levels. The nearest most crucial support level is $10.63; however, this level is smaller than the $10.95 resistance.
A bearish breakout below the 100-EMA could be devastating for the price of LINK as there are almost no support levels until $7.83, the 200-EMA. On the other hand, if LINK can bounce from the 100-EMA above the 50-EMA and turn it into support, the momentum will shift in favor of the bulls despite intense resistance levels.
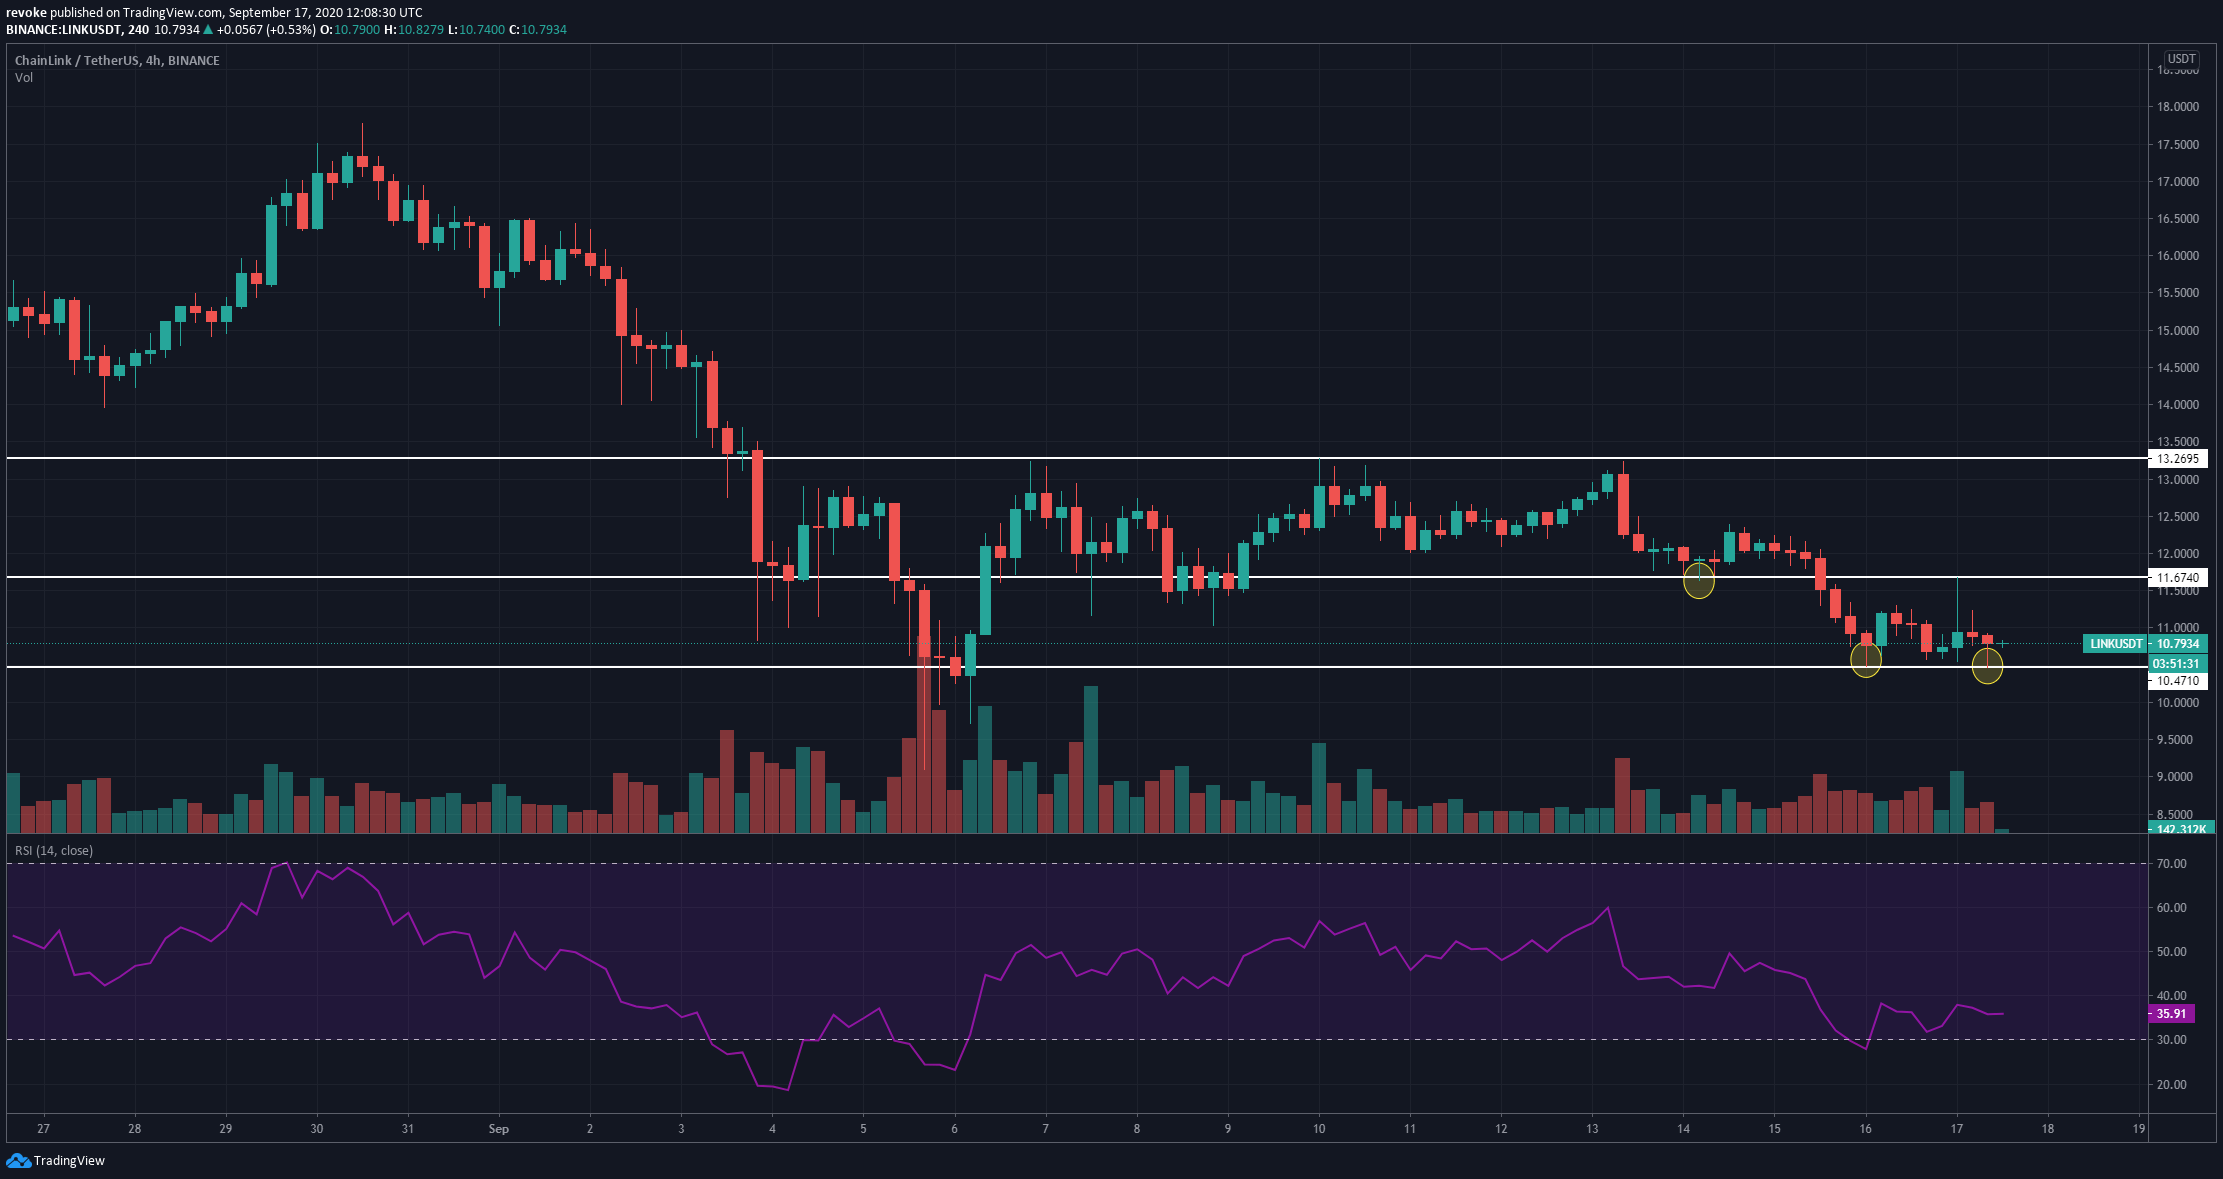
LINK/USD 4-hour chart
In the shorter time frame, LINK bulls have managed to hold a double bottom at $10.47, but the downtrend still stands. The next short-term resistance is $11.67 and then the high at $12.38. A breakout above this last level would represent a shift towards an uptrend; however, LINK would still face a robust resistance level at $13.28.
Information on these pages contains forward-looking statements that involve risks and uncertainties. Markets and instruments profiled on this page are for informational purposes only and should not in any way come across as a recommendation to buy or sell in these assets. You should do your own thorough research before making any investment decisions. FXStreet does not in any way guarantee that this information is free from mistakes, errors, or material misstatements. It also does not guarantee that this information is of a timely nature. Investing in Open Markets involves a great deal of risk, including the loss of all or a portion of your investment, as well as emotional distress. All risks, losses and costs associated with investing, including total loss of principal, are your responsibility. The views and opinions expressed in this article are those of the authors and do not necessarily reflect the official policy or position of FXStreet nor its advertisers.