Bitcoin Technical Analysis: BTC/USD cannot progress past very stubborn supply zone, bulls tamed for now
|- Bitcoin price stabilizes after the chunky bull run seen in the prior session.
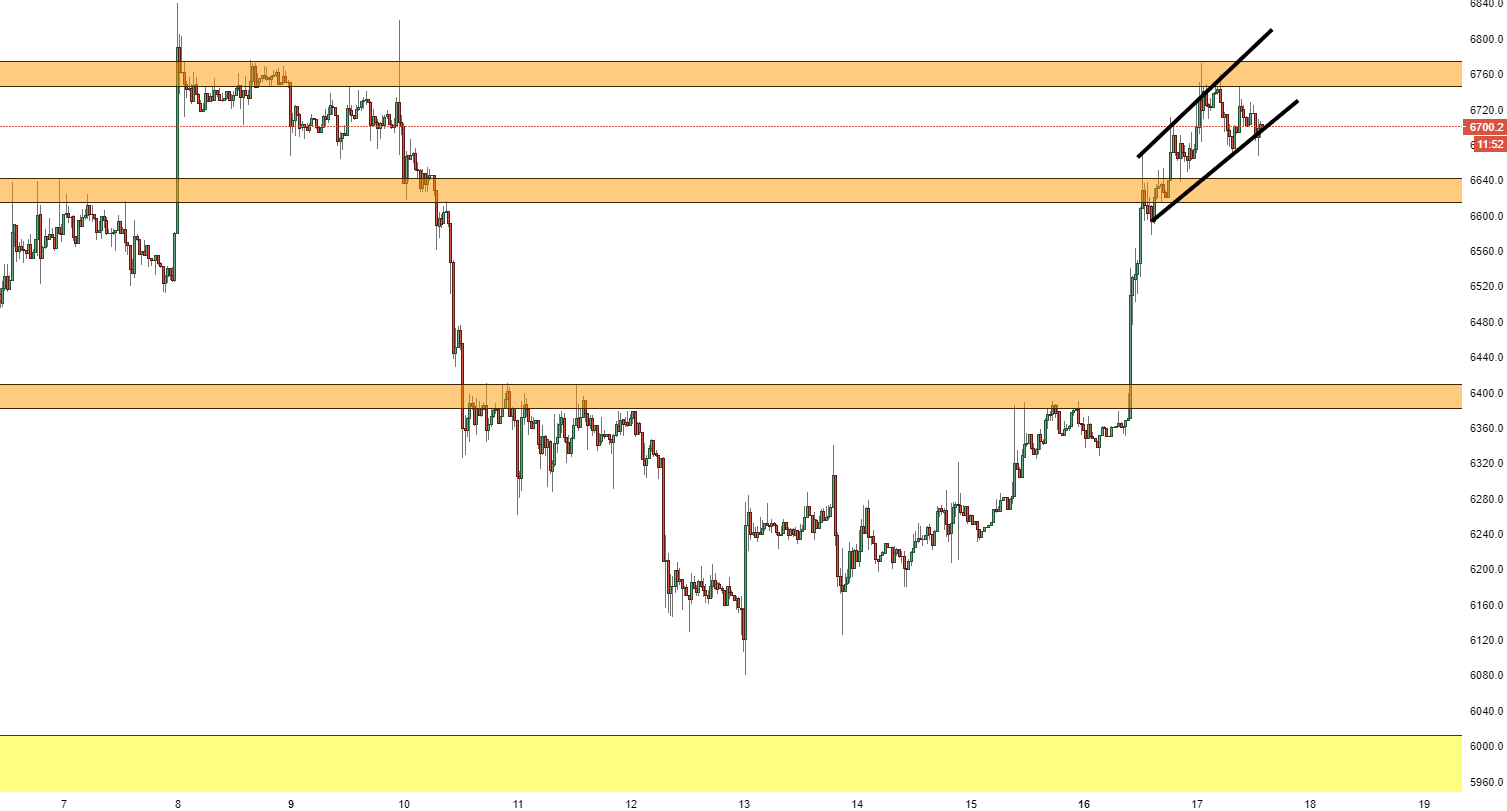
- BTC/USD does not have enough momentum at this time, to pass through supply zone, $6745-6775.
- Rising wedge pattern can be seen on the 30-minute chart view.
BTC/USD 30-minute chart
Spot rate: 6697.5
Relative change: -0.47%
High: 6771.0
Low: 6666.0
Trend: Neutral
Resistance 1: 6728.0, (resistance on 60-minute chart).
Resistance 2: 6745.0, supply zone entry.
Resistance 3: 6775, (resistance on 60-minute chart) & supply zone.
Support 1: 6690.5, lower wedge support.
Support 2: 6640.0, demand zone.
Support 3: 6561.2, (support on 60-minute chart).
Information on these pages contains forward-looking statements that involve risks and uncertainties. Markets and instruments profiled on this page are for informational purposes only and should not in any way come across as a recommendation to buy or sell in these assets. You should do your own thorough research before making any investment decisions. FXStreet does not in any way guarantee that this information is free from mistakes, errors, or material misstatements. It also does not guarantee that this information is of a timely nature. Investing in Open Markets involves a great deal of risk, including the loss of all or a portion of your investment, as well as emotional distress. All risks, losses and costs associated with investing, including total loss of principal, are your responsibility. The views and opinions expressed in this article are those of the authors and do not necessarily reflect the official policy or position of FXStreet nor its advertisers.