Bitcoin price analysis: BTC/USD sliding down, threatening to retest 2018 low
|- Bitcoin dominance continues growing amid the market slump.
- Bitcoin futures trading volumes are diminishing.
- BTC/USD is trading within a triangle pattern.
Bitcoin touched $6,176 low on Tuesday amid ongoing sell-off on the cryptocurrency market. While the digital coin No. 1 managed to recover above $6,200 to trade at $6,289 by press-time, it is still 1.3% since this time yesterday.
Bitcoin dominance growing
The wide-scale decline has reduced the total value of the cryptocurrency market to $189.9B for the first time since November 2017. At the same time, the share of Bitcoin is growing steadily. Now the Bitcoin dominance index stands at 57.3%, according to CoinMarketCap data. It means that traders and investors don't want to take risks with volatile and less liquid altcoins, flocking to the "digital gold" when things get tough.
Bitcoin Futures lose volumes
Meanwhile, bitcoin futures volumes dropped both on CME and CBOE with the futures prices continued tumbling and finished Tuesday lower for the second day running.
“The September XBT futures bounced off those levels on numerous occasions over the last three months. If the market fails to hold the $6,000 handle, then traders will almost certainly eye the contract lows ($5,850) and all-time XBT futures lows of $5,755 on June 29,” Kevin Davitt, senior instructor for The Options Institute commented.
The expert added that Bitcoin might retest 2018 low once $6,000 is broken, which would also become a record low for the futures contract.
Bitcoin's technical picture
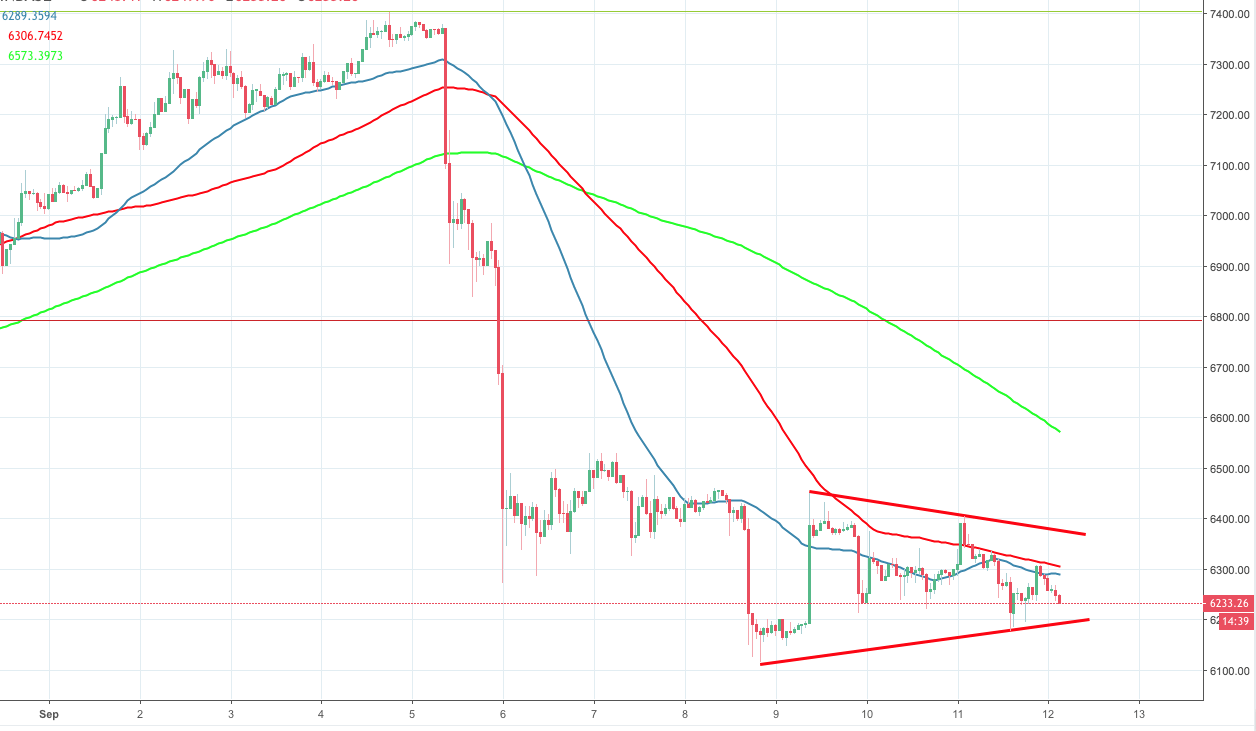
On the intraday level, BTC/USD is sitting in a triangle pattern with the vital support created by its lower line at $6,190. Once it is cleared, the sell-off may be extended towards Saturday's low at $6,116 and to $6,000. On the upside, the recovery is capped by SMA50 and SMA100 (1-hour) clustered on approach to $6,300. It is followed by $6,375, which is the upper line of the above-mentioned triangle.
BTC/USD, 1-hour chart
Get 24/7 Crypto updates in our social media channels: Give us a follow at @FXSCrypto and our FXStreet Crypto Trading Telegram channel
Information on these pages contains forward-looking statements that involve risks and uncertainties. Markets and instruments profiled on this page are for informational purposes only and should not in any way come across as a recommendation to buy or sell in these assets. You should do your own thorough research before making any investment decisions. FXStreet does not in any way guarantee that this information is free from mistakes, errors, or material misstatements. It also does not guarantee that this information is of a timely nature. Investing in Open Markets involves a great deal of risk, including the loss of all or a portion of your investment, as well as emotional distress. All risks, losses and costs associated with investing, including total loss of principal, are your responsibility. The views and opinions expressed in this article are those of the authors and do not necessarily reflect the official policy or position of FXStreet nor its advertisers.