Gold Forecast: $1300 a done deal?
|- Descending triangle breakout signals continuation of the rally from the July low $1204.70.
- Big jump in open positions in the call options points to bullish sentiment in the options market.
Gold (XAU/USD) looks set to test $1300 levels sooner rather than later. Prices may have retreated from yesterday's three-week high of $1287, giving an impression of a weak bullish move, although the price chart and the options market activity point indicate better days ahead of the safe haven yellow metal.
As of writing, the metal is trading at $1283.70/Oz levels.
Daily chart
- The above chart shows a descending triangle breakout, which is a continuation pattern, meaning the rally from the Jul. 10 low of $1204.70 has resumed.
- The bullish breakout was confirmed on Nov. 6. Bears attempted to push the metal back below the trendline support on the following day, but failed.
- Clearly, the doors are open for a rally to $1300 levels.
- Only an end-of-the-day close below $1270 would abort the bullish view on the daily chart.
The bullish story doesn't end here. A look at the options market activity indicates strong demand for the bullish bets (call options).
Gold OGZ7 Open Interest (OI) Change: Current (Nov 8 - Prelim) vs. Nov 1
| Call Summary | |||||
| Total | ITM | OTM | |||
| OI | Chg | OI | Chg | OI | Chg |
| 277,148 | 8,322 | 31,890 | 342 | 245,258 | 7,980 |
| Put Summary | |||||
| Total | ITM | OTM | |||
| OI | Chg | OI | Chg | OI | Chg |
| 170,488 | 1,667 | 22,432 | 17 | 148,056 | 1,650 |
Over the last one week, the open interest or open positions in the call options jumped by 8322 contracts. Meanwhile, put options added only 1667 contracts. Clearly, the investors have positioned for a rally in gold prices.
Open interest change
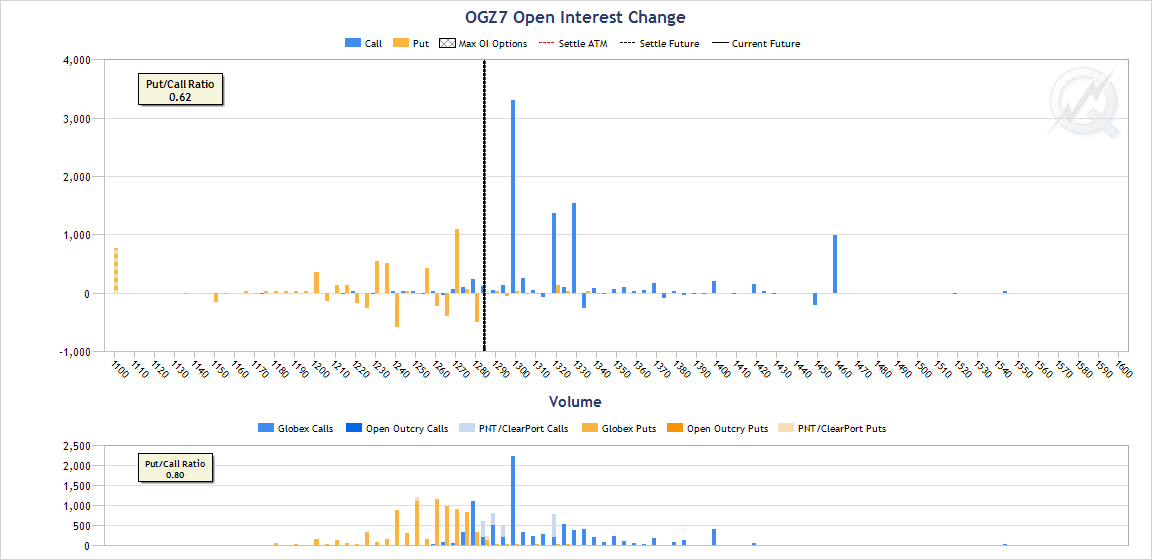
Source: CME
The above chart shows-
- $1300 call has added 3304 contracts last week. Meanwhile, $1270 put added 1090 contracts.
- Big jump in the OI in $1300 call suggests the yellow metal is seen rallying at least to $1300 levels in the short-run.
View
- Gold is likely to test $1300-$1306.05 (Oct. 6 high). A violation there would confirm a double bottom reversal and shall open up upside towards the September high of $1357.52.
- On the downside, a break below the 200-day MA level of $1263 would revive the bearish move.
Information on these pages contains forward-looking statements that involve risks and uncertainties. Markets and instruments profiled on this page are for informational purposes only and should not in any way come across as a recommendation to buy or sell in these assets. You should do your own thorough research before making any investment decisions. FXStreet does not in any way guarantee that this information is free from mistakes, errors, or material misstatements. It also does not guarantee that this information is of a timely nature. Investing in Open Markets involves a great deal of risk, including the loss of all or a portion of your investment, as well as emotional distress. All risks, losses and costs associated with investing, including total loss of principal, are your responsibility. The views and opinions expressed in this article are those of the authors and do not necessarily reflect the official policy or position of FXStreet nor its advertisers.