GBP/USD analysis: Is between smas
|
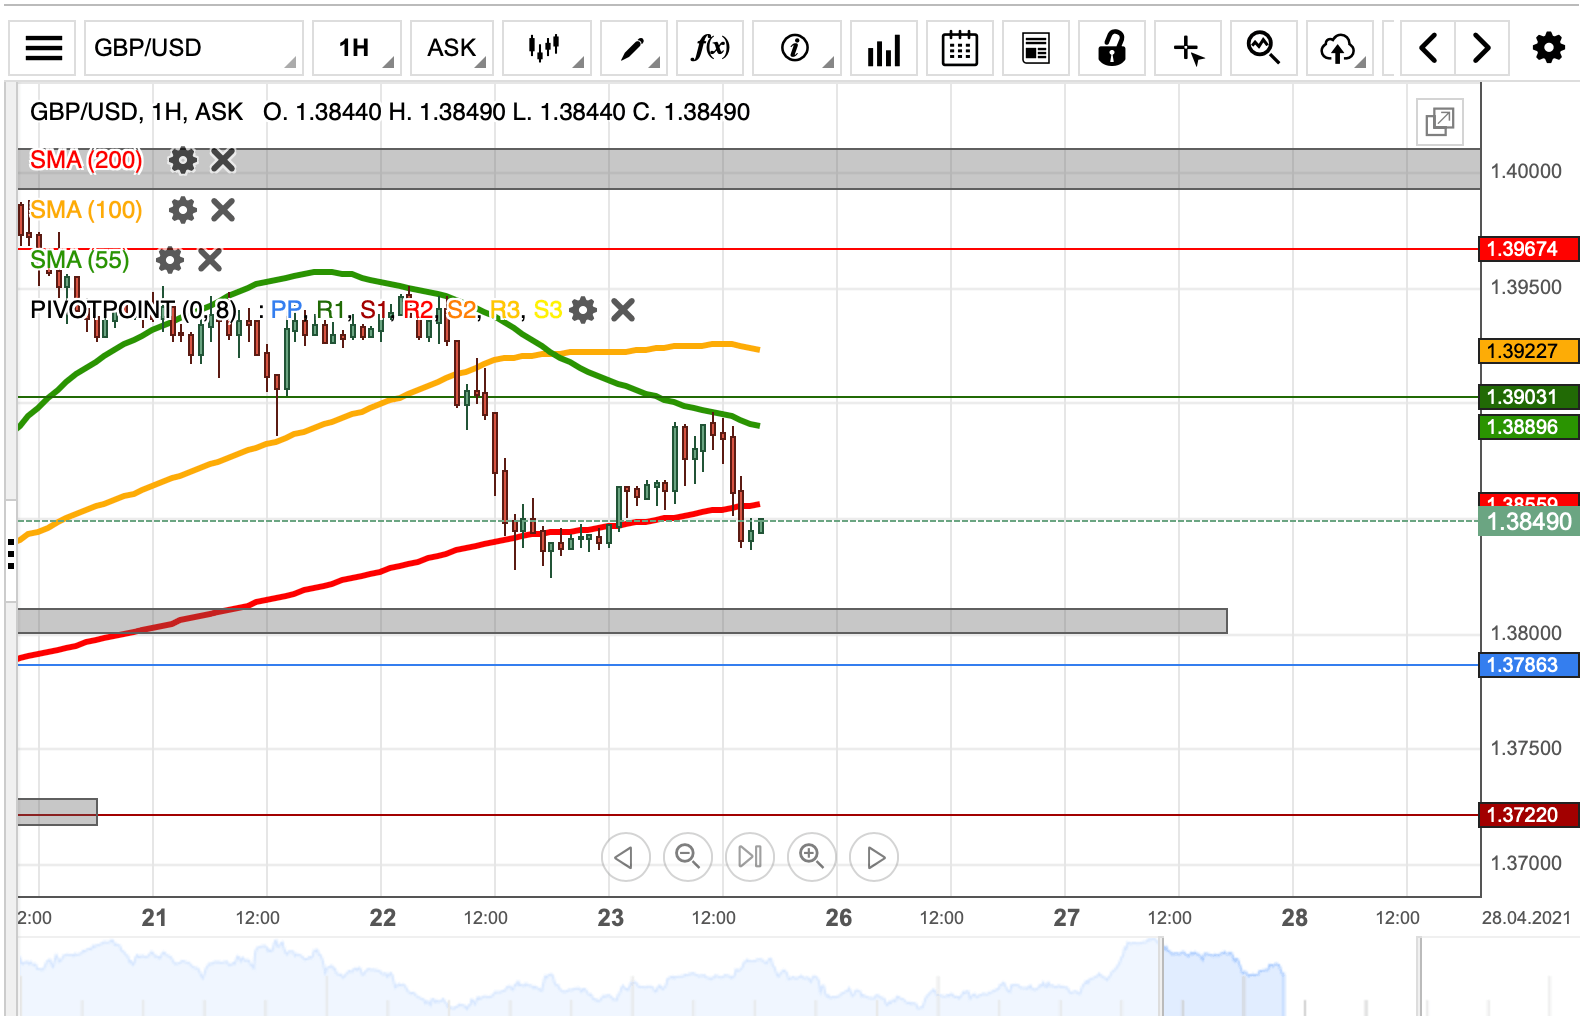
On Friday, the GBP/USD currency exchange rate began to trade sideways between the support of the 200-hour simple moving average at 1.3855 and the resistance of the 55-hour SMA at 1.3893.
In the case of the rate breaking out of the squeeze to the downside, the rate would most likely look for support first in the 1.3800 level and afterwards the weekly simple pivot point at 1.3786. Below these levels, only the 1.3750 level could provide support.
On the other hand, a potential surge would immediately find resistance in the weekly R1 simple pivot point and the 1.3900 level. Above them, the 100-hour SMA could provide resistance near 1.3925.
Information on these pages contains forward-looking statements that involve risks and uncertainties. Markets and instruments profiled on this page are for informational purposes only and should not in any way come across as a recommendation to buy or sell in these assets. You should do your own thorough research before making any investment decisions. FXStreet does not in any way guarantee that this information is free from mistakes, errors, or material misstatements. It also does not guarantee that this information is of a timely nature. Investing in Open Markets involves a great deal of risk, including the loss of all or a portion of your investment, as well as emotional distress. All risks, losses and costs associated with investing, including total loss of principal, are your responsibility. The views and opinions expressed in this article are those of the authors and do not necessarily reflect the official policy or position of FXStreet nor its advertisers.